I designed a robust, enterprise-grade cloud infrastructure using Nutanix with integrated security controls and automated management to ensure high availability, scalability, and policy-driven governance across hybrid cloud environments. These projects include Nutanix Xi Beam, Nutanix Flow, and Nutanix DR Visualization. These projects earned me four design patents.
Nutanix is a cloud platform that simplifies and unifies hybrid multicloud infrastructure,
providing a single, open software platform for hybrid and multi‑cloud applications and their
data.
Reducing the complexity and cost of IT operations with hyper-converged
infrastructure and intelligent automation
Delivering faster insights and performance with modern database management
and analytics
Cloud Operating System leveraging Data Visualization and Design to simplify
operations
Nutanix Xi Beam provides visibility and rich analytics detailing cloud consumption patterns, along with one-click optimizations, across both public and private clouds.
Xi Beam identifies idle and under-utilized cloud resources, delivers specific recommendations to resize infrastructure services, and uses machine intelligence- driven algorithms to provide reserved instance purchase recommendations for deep cost savings.
Project 01: Nutanix Beam Overview
Rethinking product flows and insights to assist in cost governance for cloud spending across platforms.
Key Users
Chief Finance Executives (CFOs), Financial Operators (FinOps)
Key Considerations
Leveraging existing design and keeping scope limited to existing or possible data
Solution
SaaS web interface with redesigned visualization addressing scale and usability
Role
Data Visualization & Experience Designer
Contribution
Team of 2 designers, UX Flows, Data Visualization
Project Duration:
6-8 months
Project Status
Concepts and Phased Execution
Research:
Consuming design research driven by Beam team
Define:
Comprehending and evaluating pain point
Design:
Concepts, Rapid high fidelity wireframing and validations
Evaluation:
Usability test of designs with stakeholders and target audience.
Admins
Financial Operations
Managers
Leaders (CFOs, CIOs)
Leveraging existing design and keeping scope limited to existing or possible data
Scope of this project only restricted to Financial Operations and Managerial operations have been considered.
Monitoring
Root Cause Analysis
Executing Recommendations
Reports and Summaries
Painpoints
Designing for trust
Navigation
Book of records
Better anomaly handling
Better Recommendations
One of the major reason for user not to trust the existing dashboard was the native cloud platform dashboard data never used to be same as in Beam.
Reason
As Beam uses multiple ways to provide insightful details such as amortizing, removing added cost etc. This led to difference in values.
As Beam support multi cloud cost governance, the navigation needed to be segmented and organized hierarchically.
Solution
The first layer of segmentation was Cloud provider and organization, then business Units, cost centers.
For the painpoint related to book of records, anomaly handling and recommendations, more evaluations related to insights, metrics and parameters to be accounted were recorded and added to the dashboard details.
Closer integration of dashboard can be done with more ML related metrics. Like pattern recognition. Recommendation engine can be more prudent to help the users.
Ask questions about how they are making decisions by seeing any data sets.
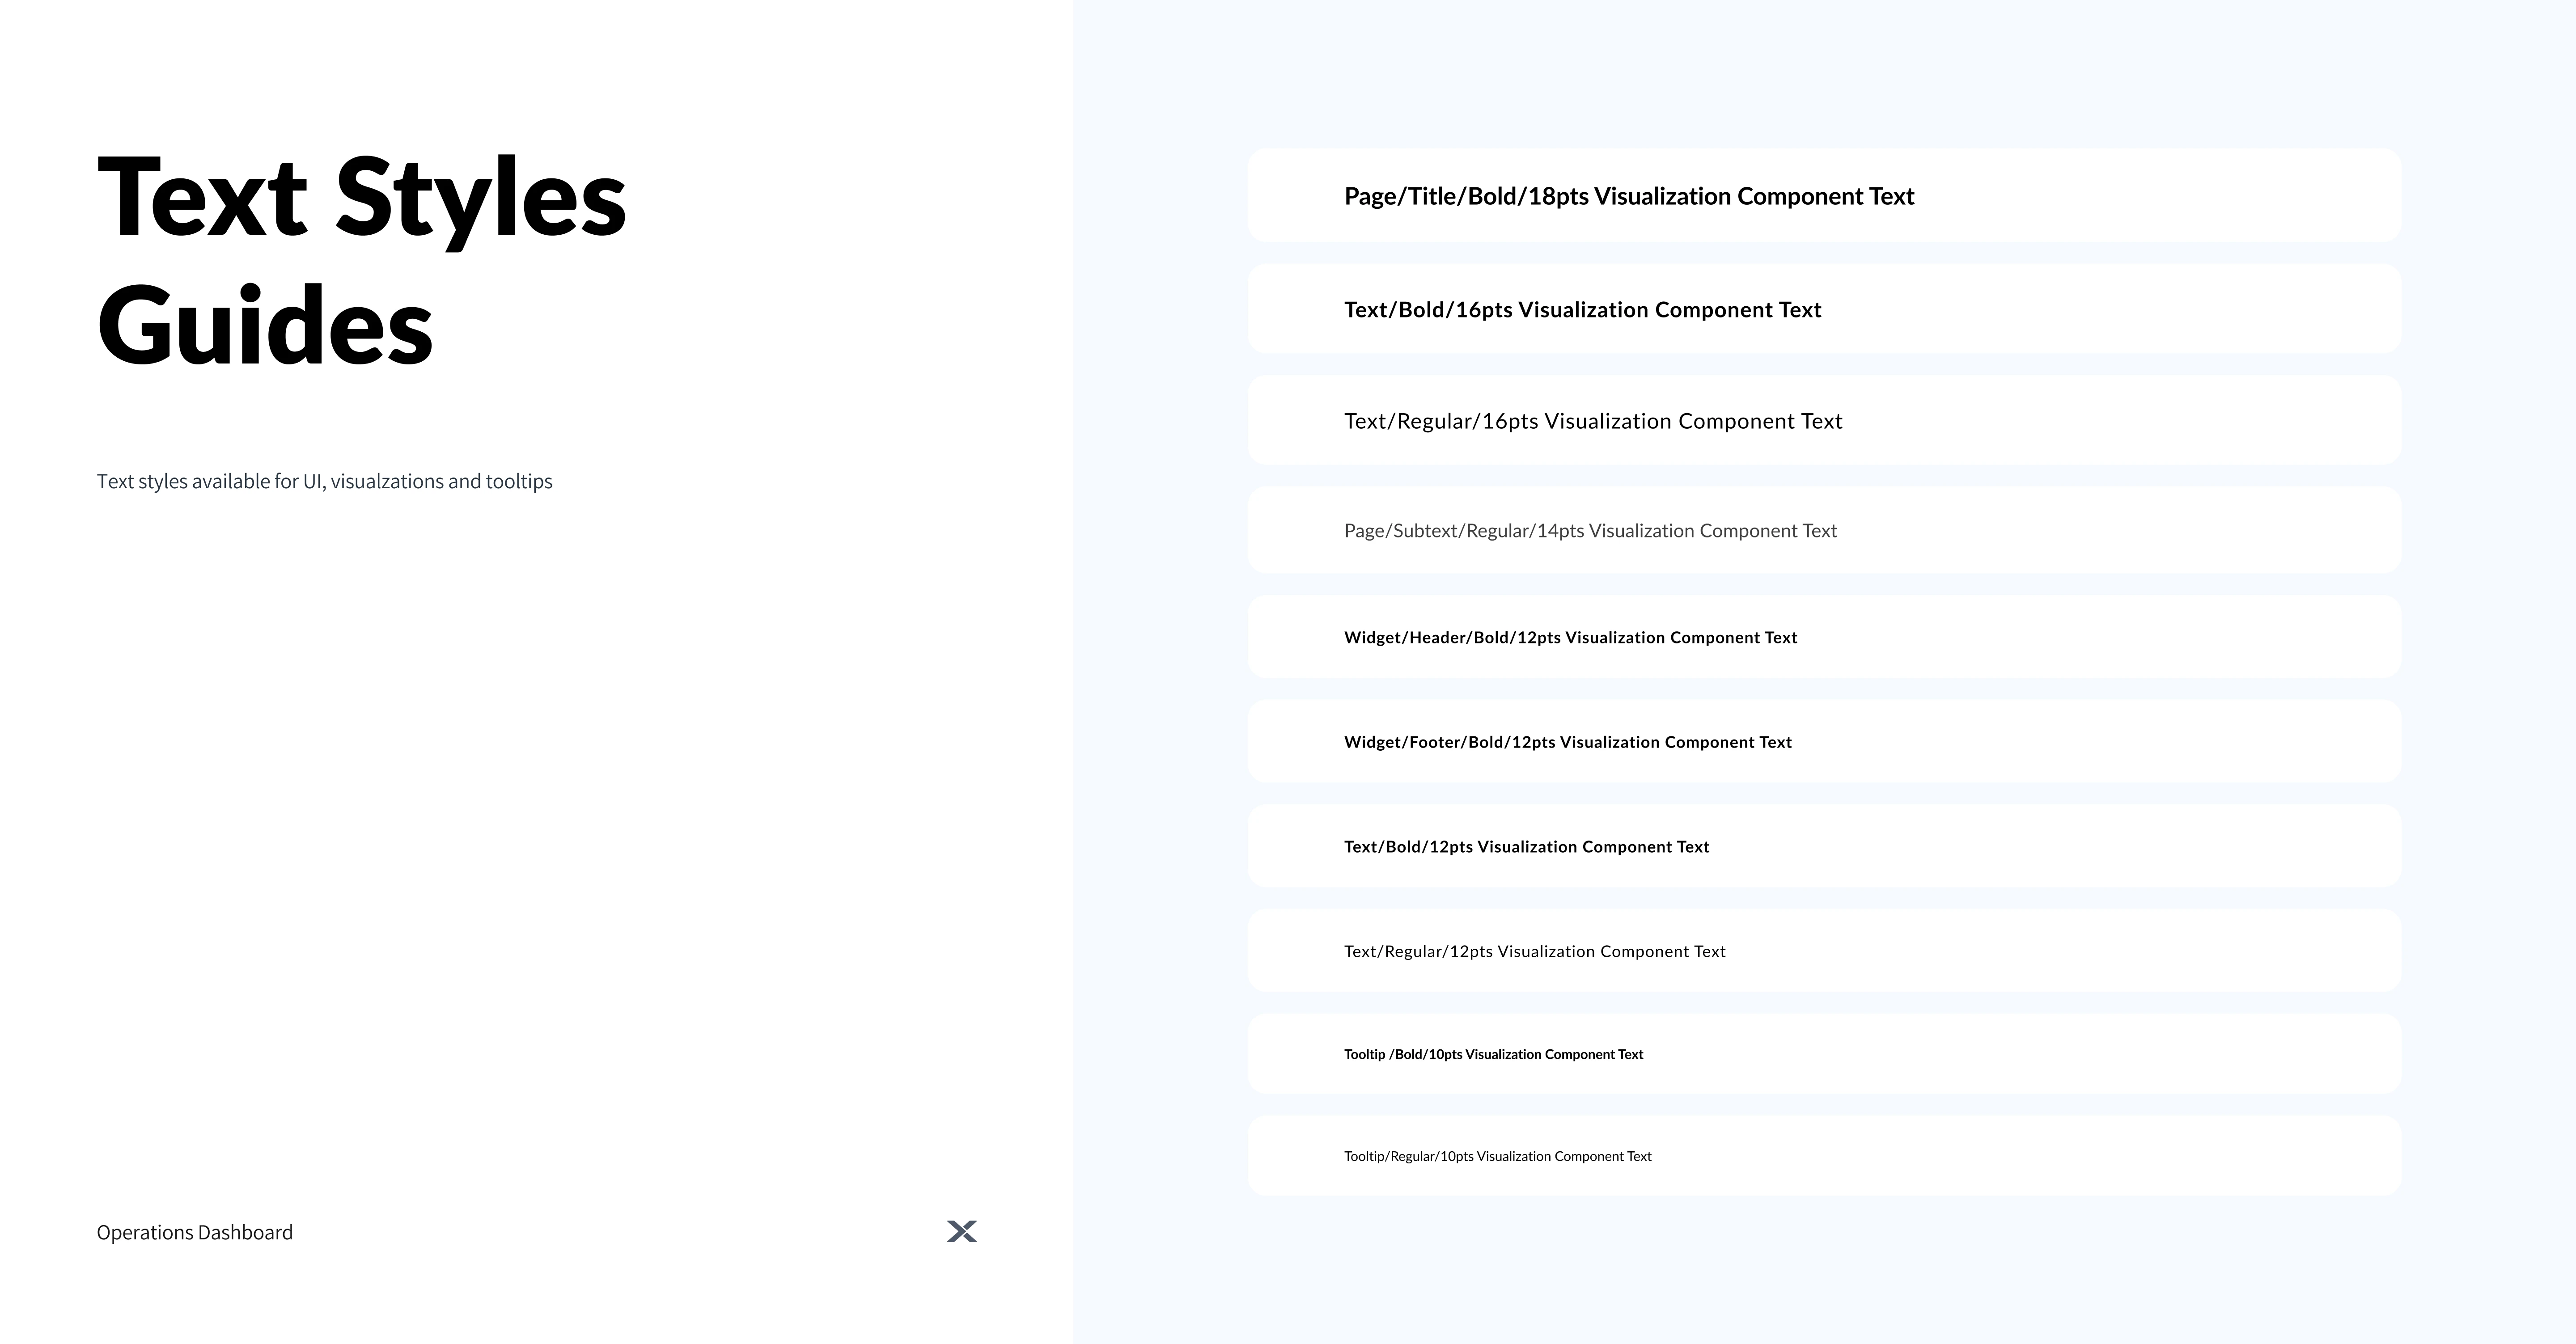
Keep labels and
values consistent.
The key question is whether to scale proportionally or responsively.
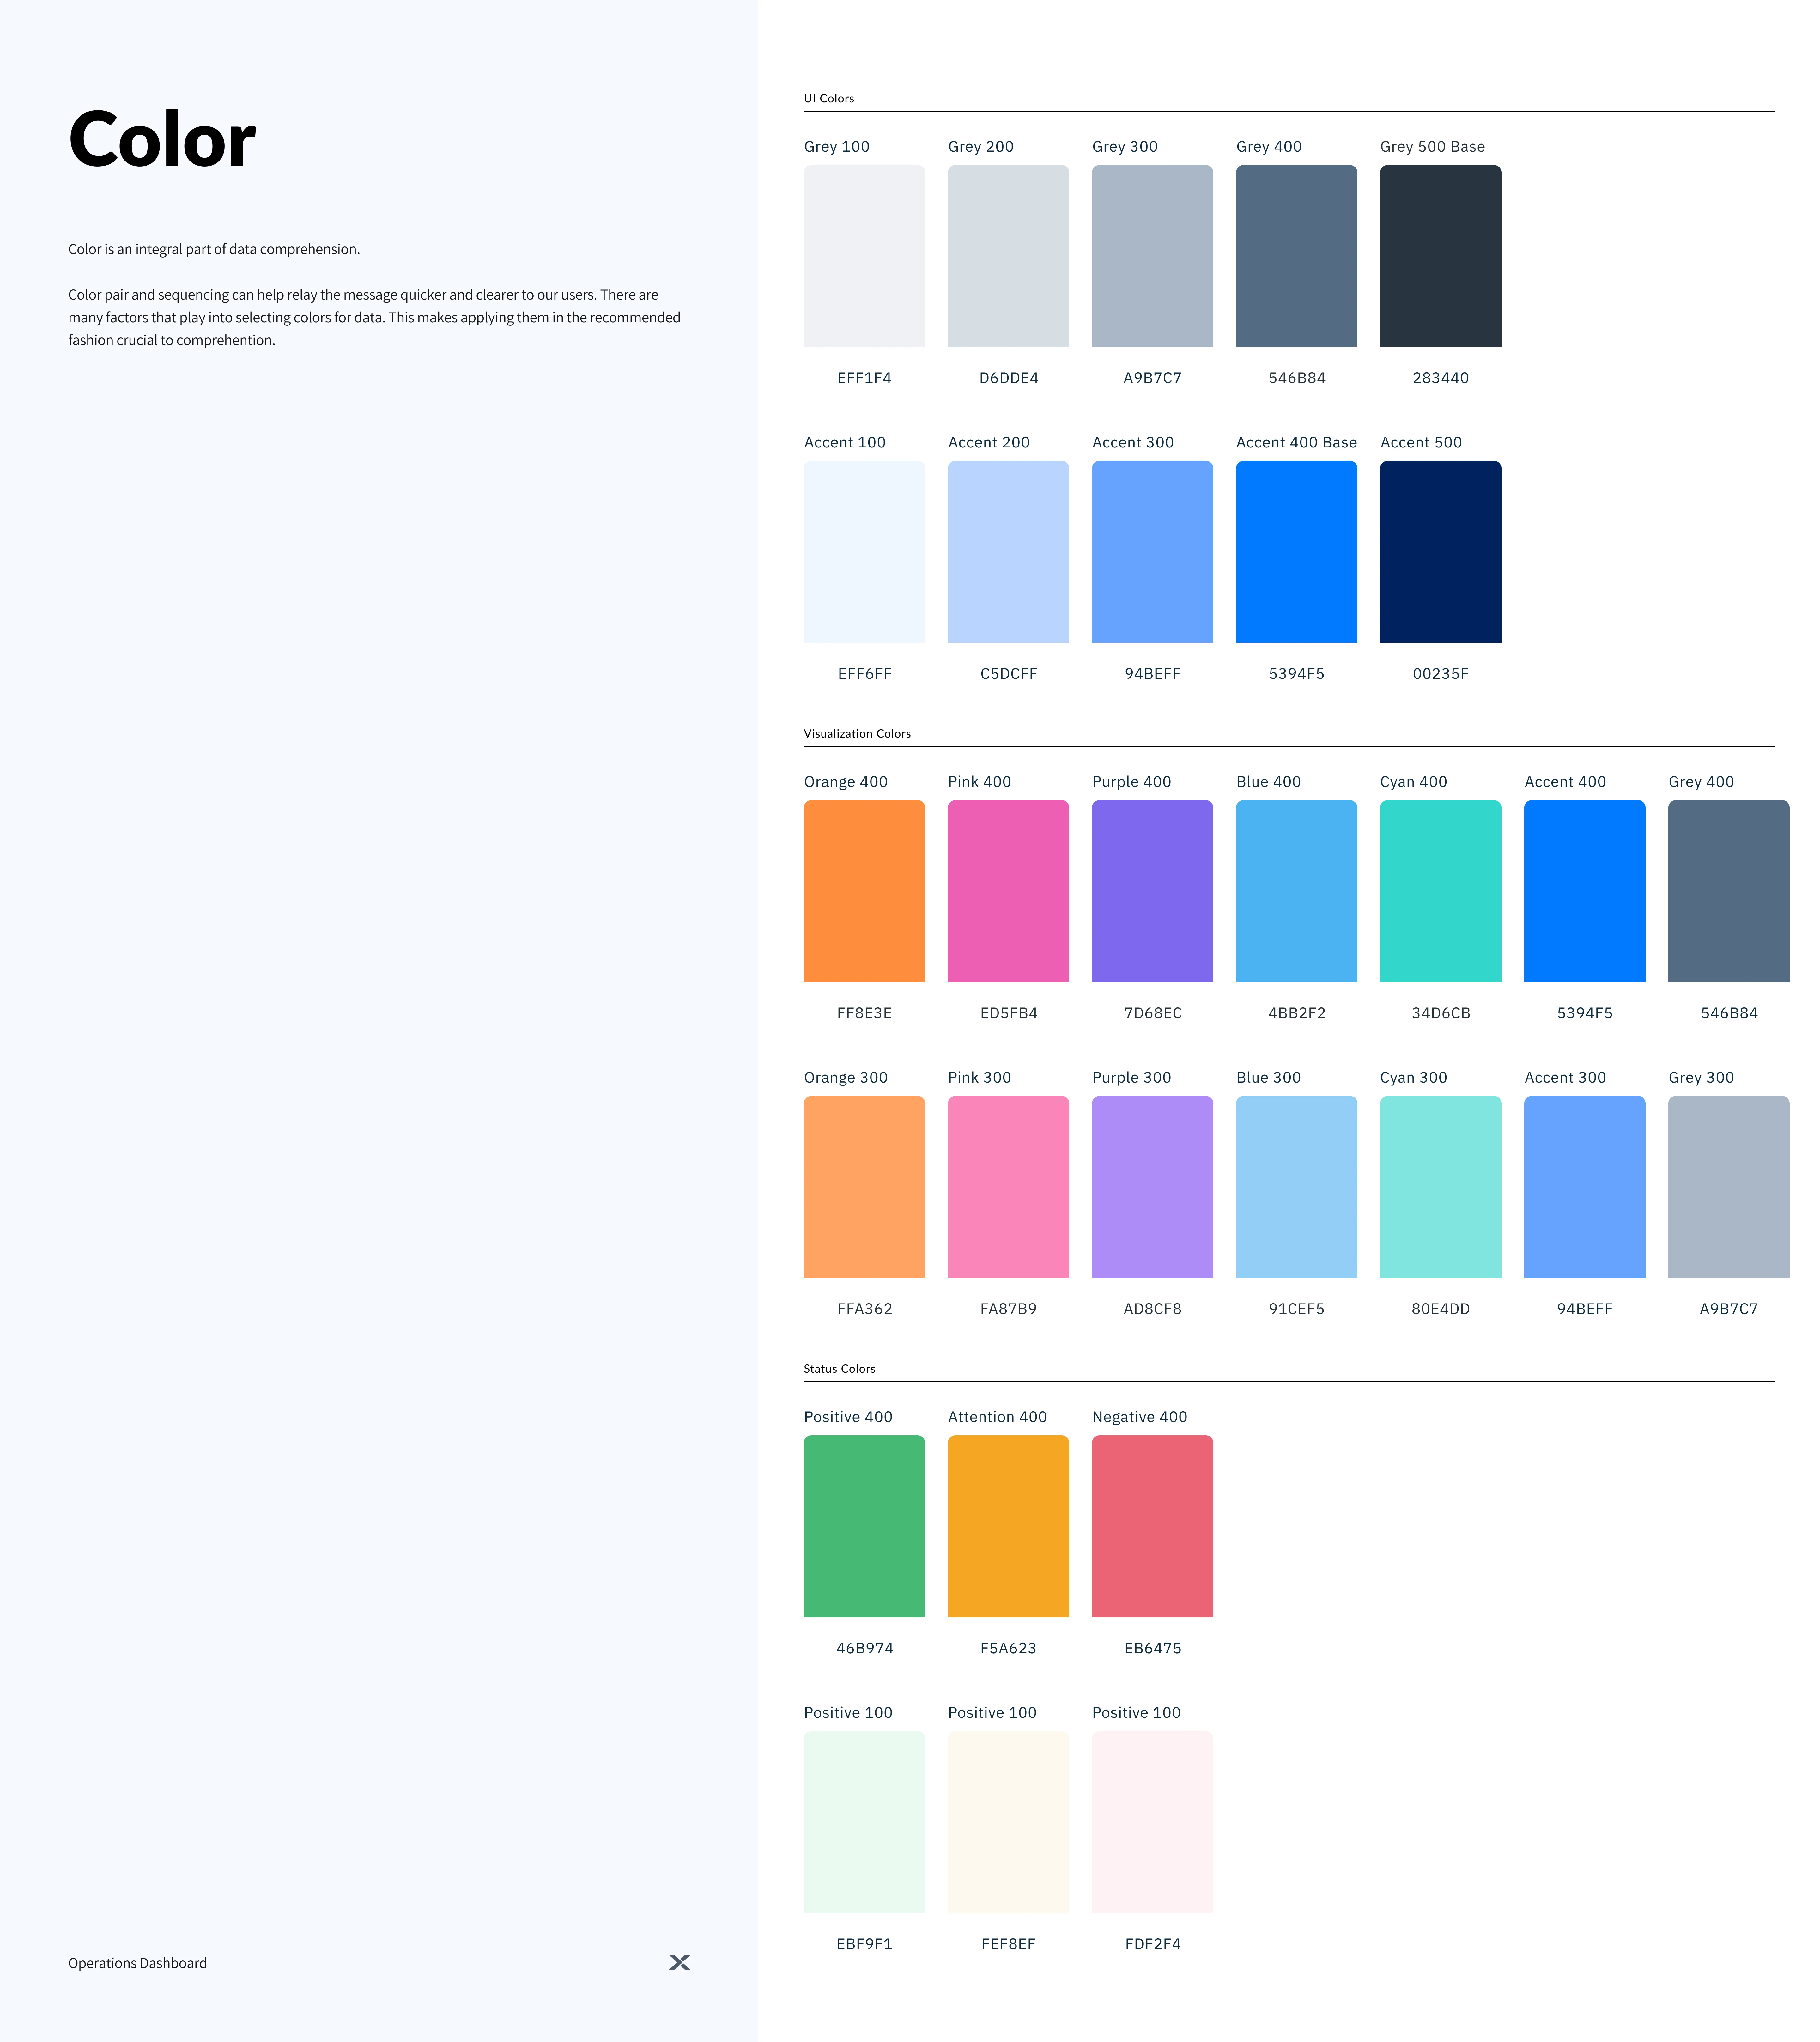
Colours plays
a
huge
role in deciding the dashboards.
Iterate and Iterate again. Closer integration with
in-house
user can help.
Not all user feedbacks is relevant. If user is asked what he wishes, user
may
ask
anything or everything.
Collaborating with management and engineering team helps with
faster
closure
Visualization for Enterprise Disaster Recovery(DR) infrastructure intends to assists user with simple reference tool to manage and troubleshoot complex enterprise DR infrastructure. The Visualization UI is a multilayer visual representation. It constitutes of geographic, topological, diagrammatic views, supported by dynamic and contextual information pane.
The visualization user interface provides information and feedback about constituting entities or components, relationships, ongoing events, configurations and alerts. It supports deep down, progressive and contextual information to perform required actions to assist with infrastructure management and troubleshooting.
02 Project Overview: DR Visualization
Simplify and enable user to monitor and perform failover of operations easily and quickly.
Key Users
DR Admins, Operations team
Key Considerations
Defining more easy way to do root cause analysis
Solution
SaaS web interface with redesigned visualization mapping mental models
Role
Data Visualization & Experience Designer
Contribution
Sole Designer, UX Flows, Data Visualization
Project Duration:
6 months
Project Status
Patented and Framework Executed
1 Patent Granted
Presented as part of CEO Leadership pitch
Nutanix DR Visualization is available in Prism Central, which is a centralized management console for multiple Nutanix clusters. Patent Granted for DR Visualization as part of internship project. The same was submitted as thesis at NID.
The project was challenging, however there were enough instances to keep the spirits high and get going. The same project was tested as part of .NEXT at New Orleans in 2020.

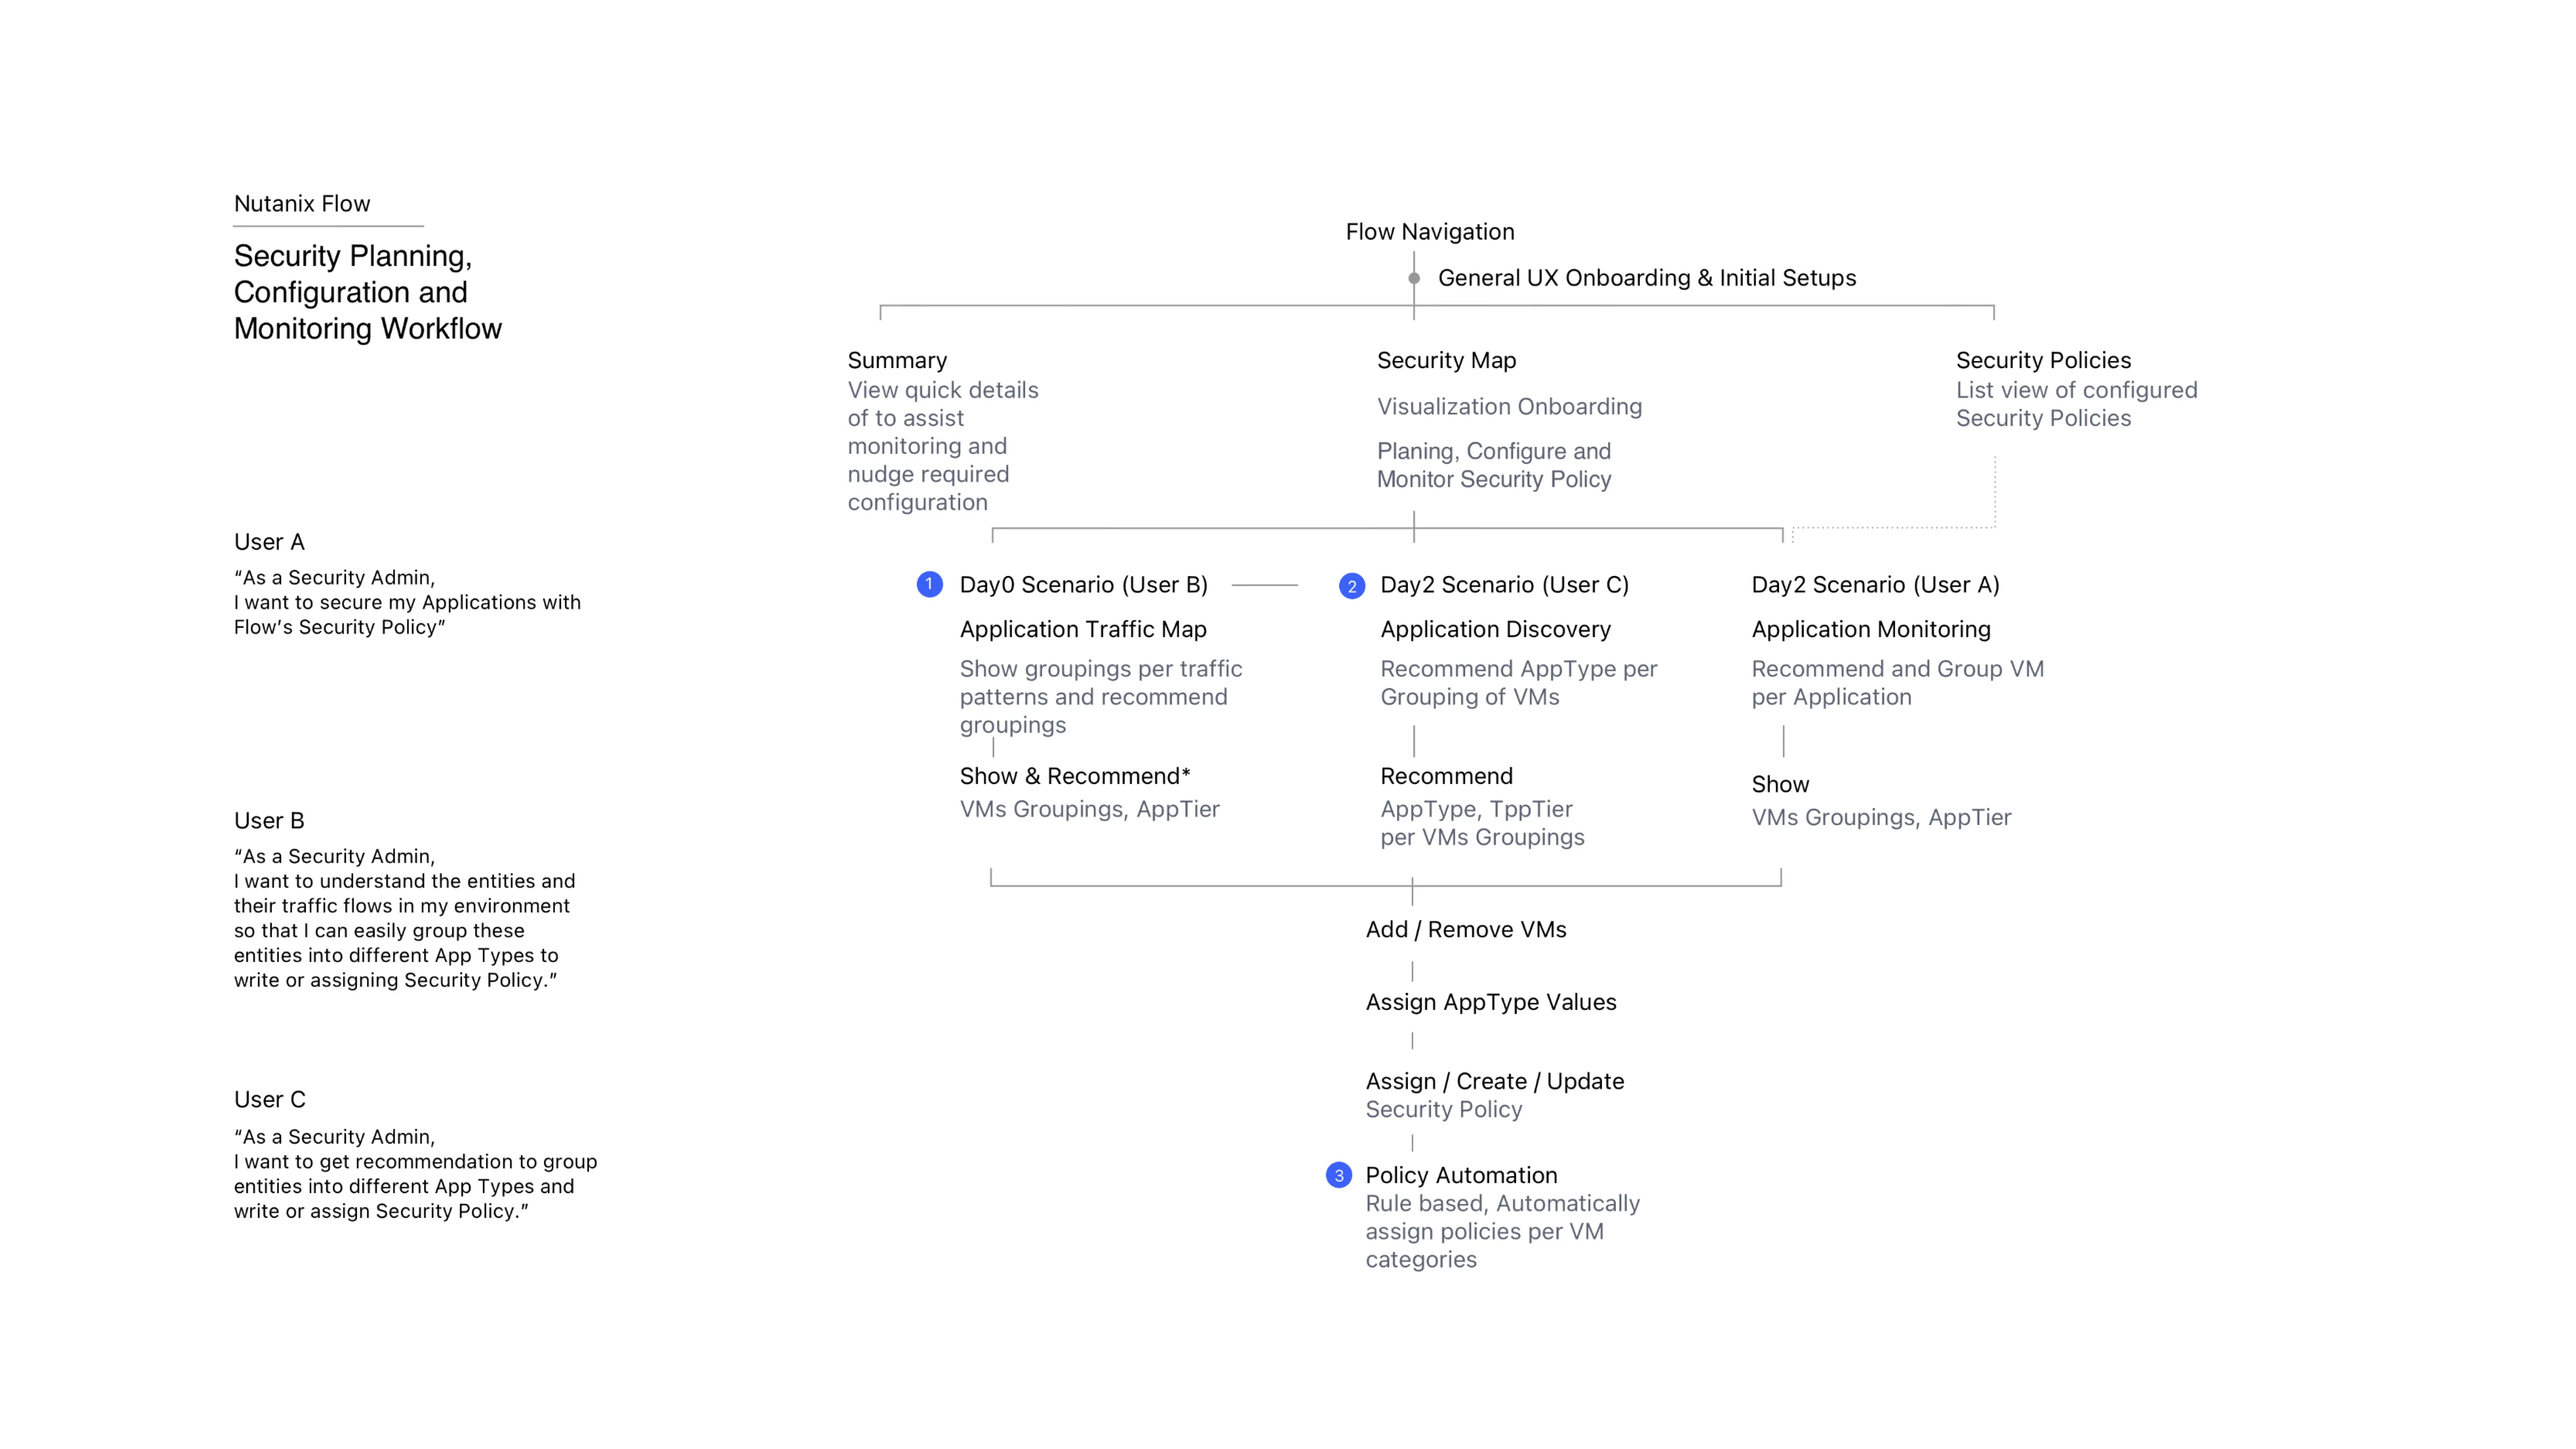
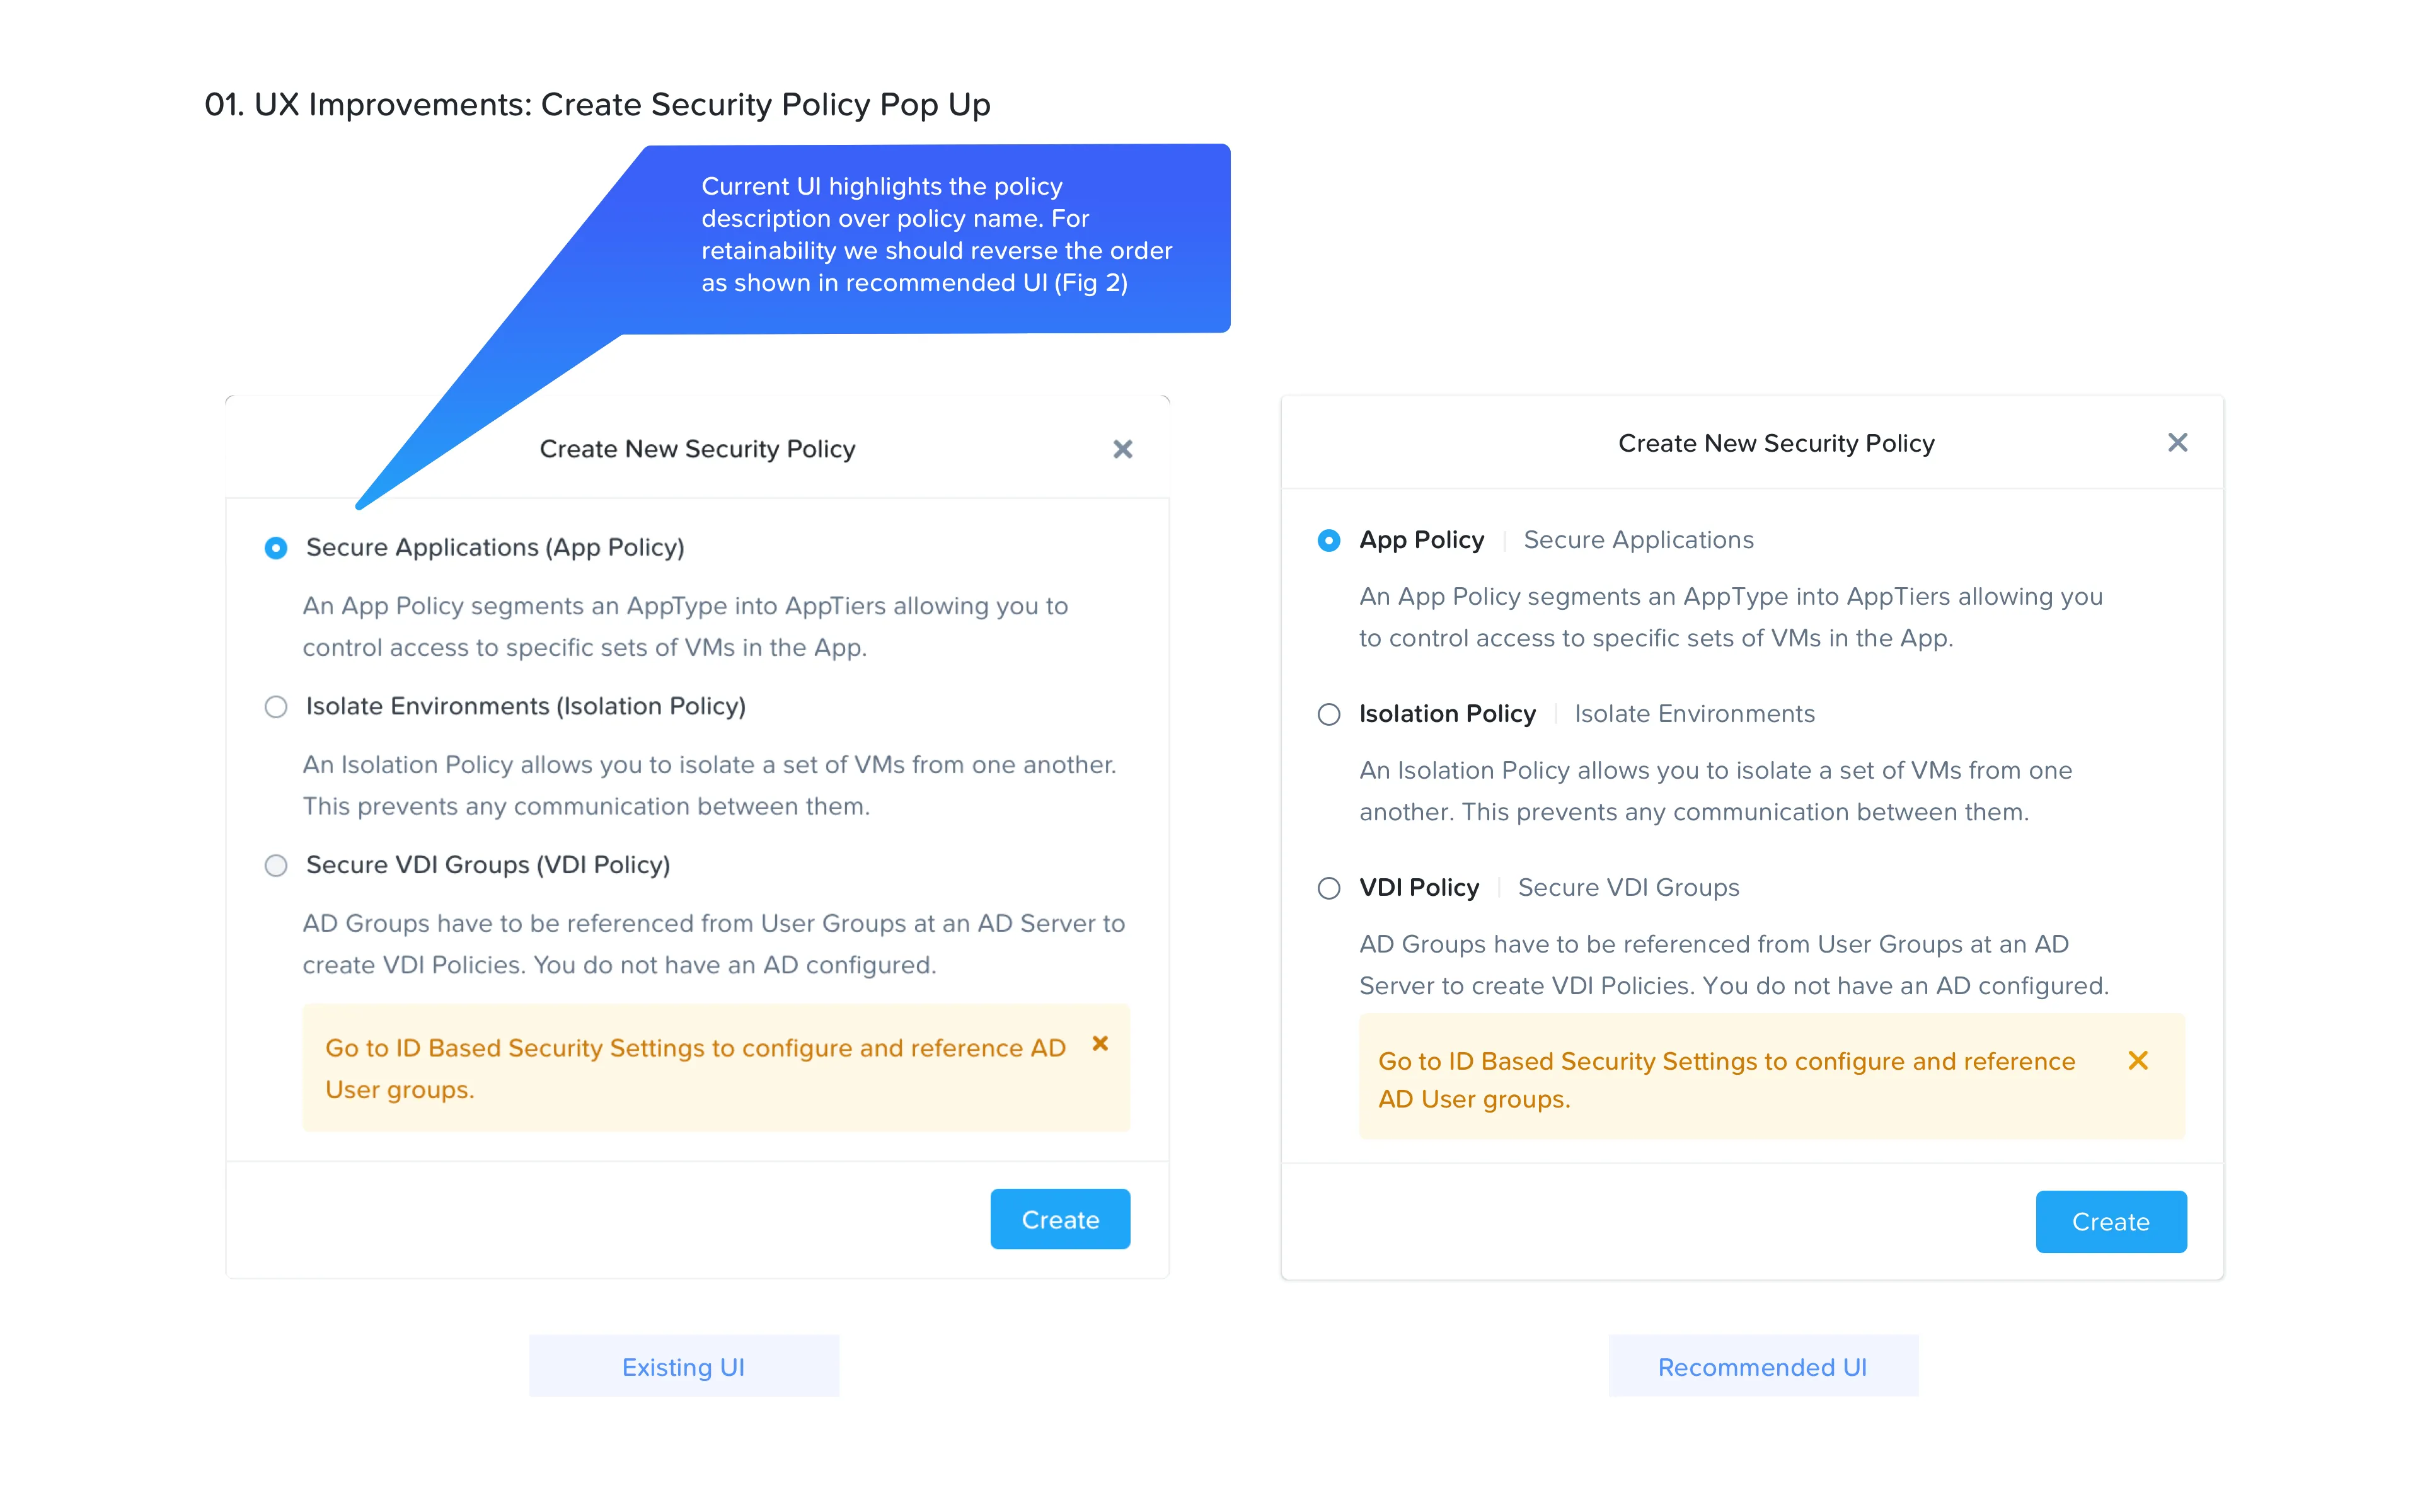
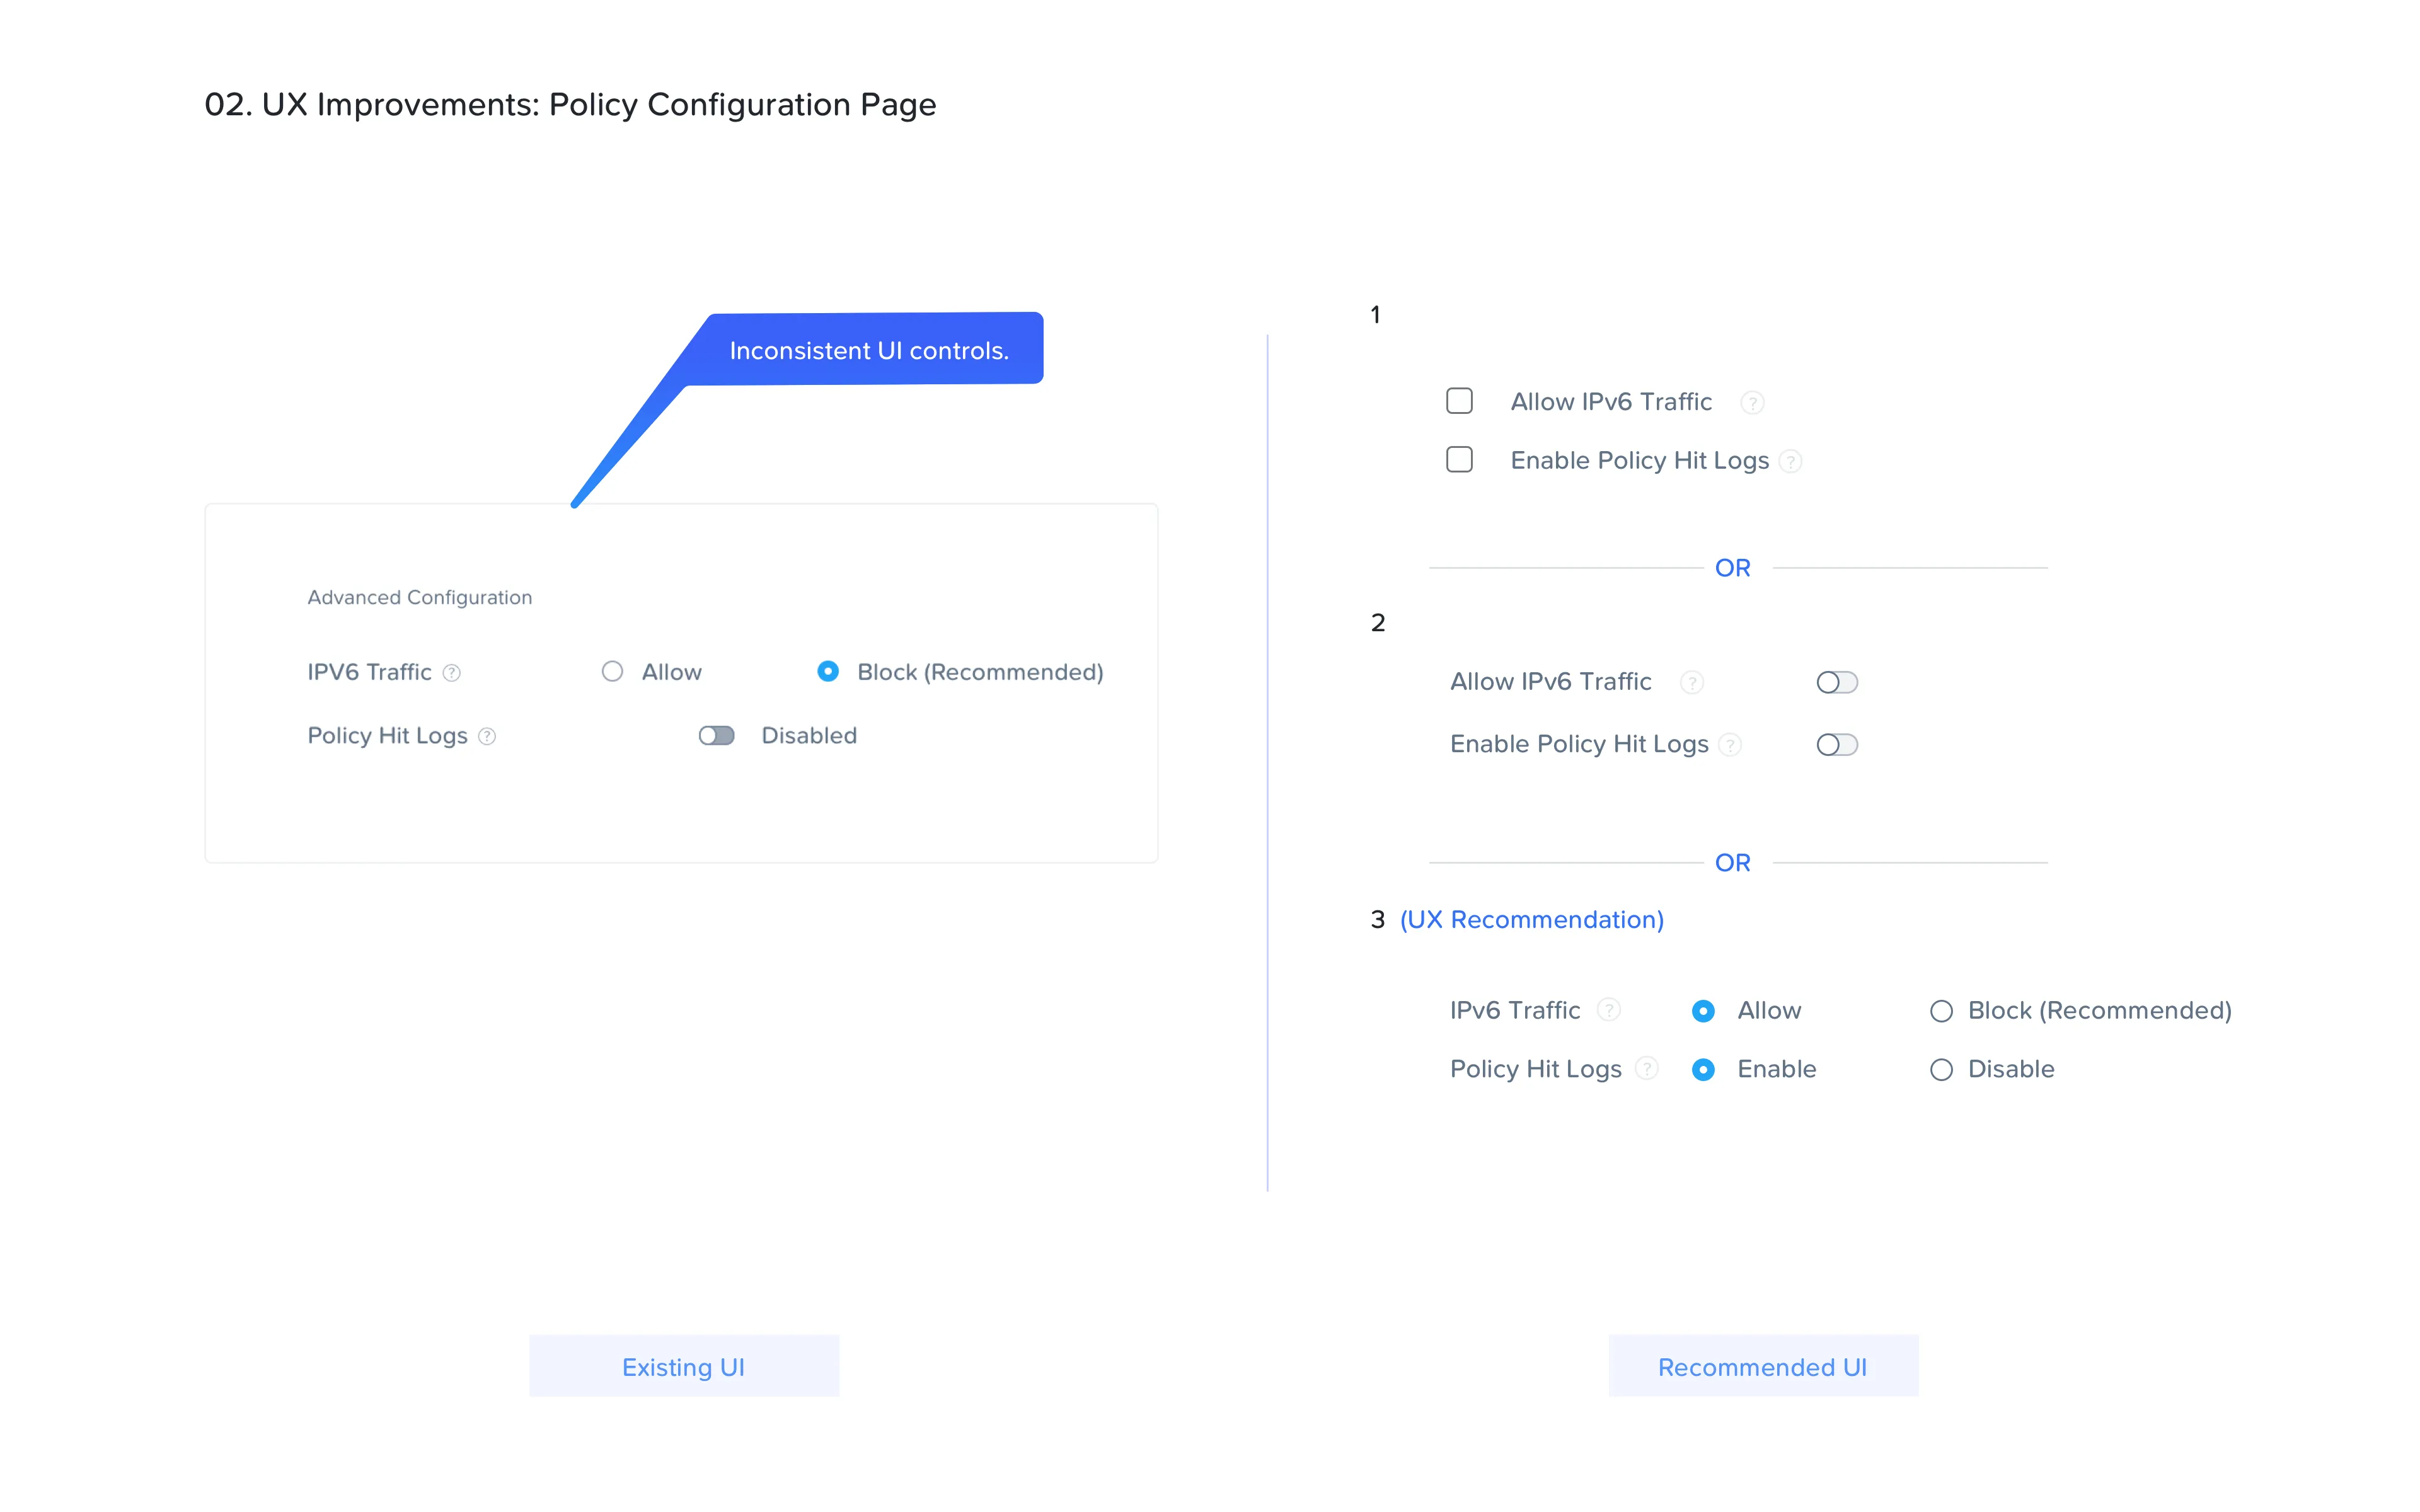
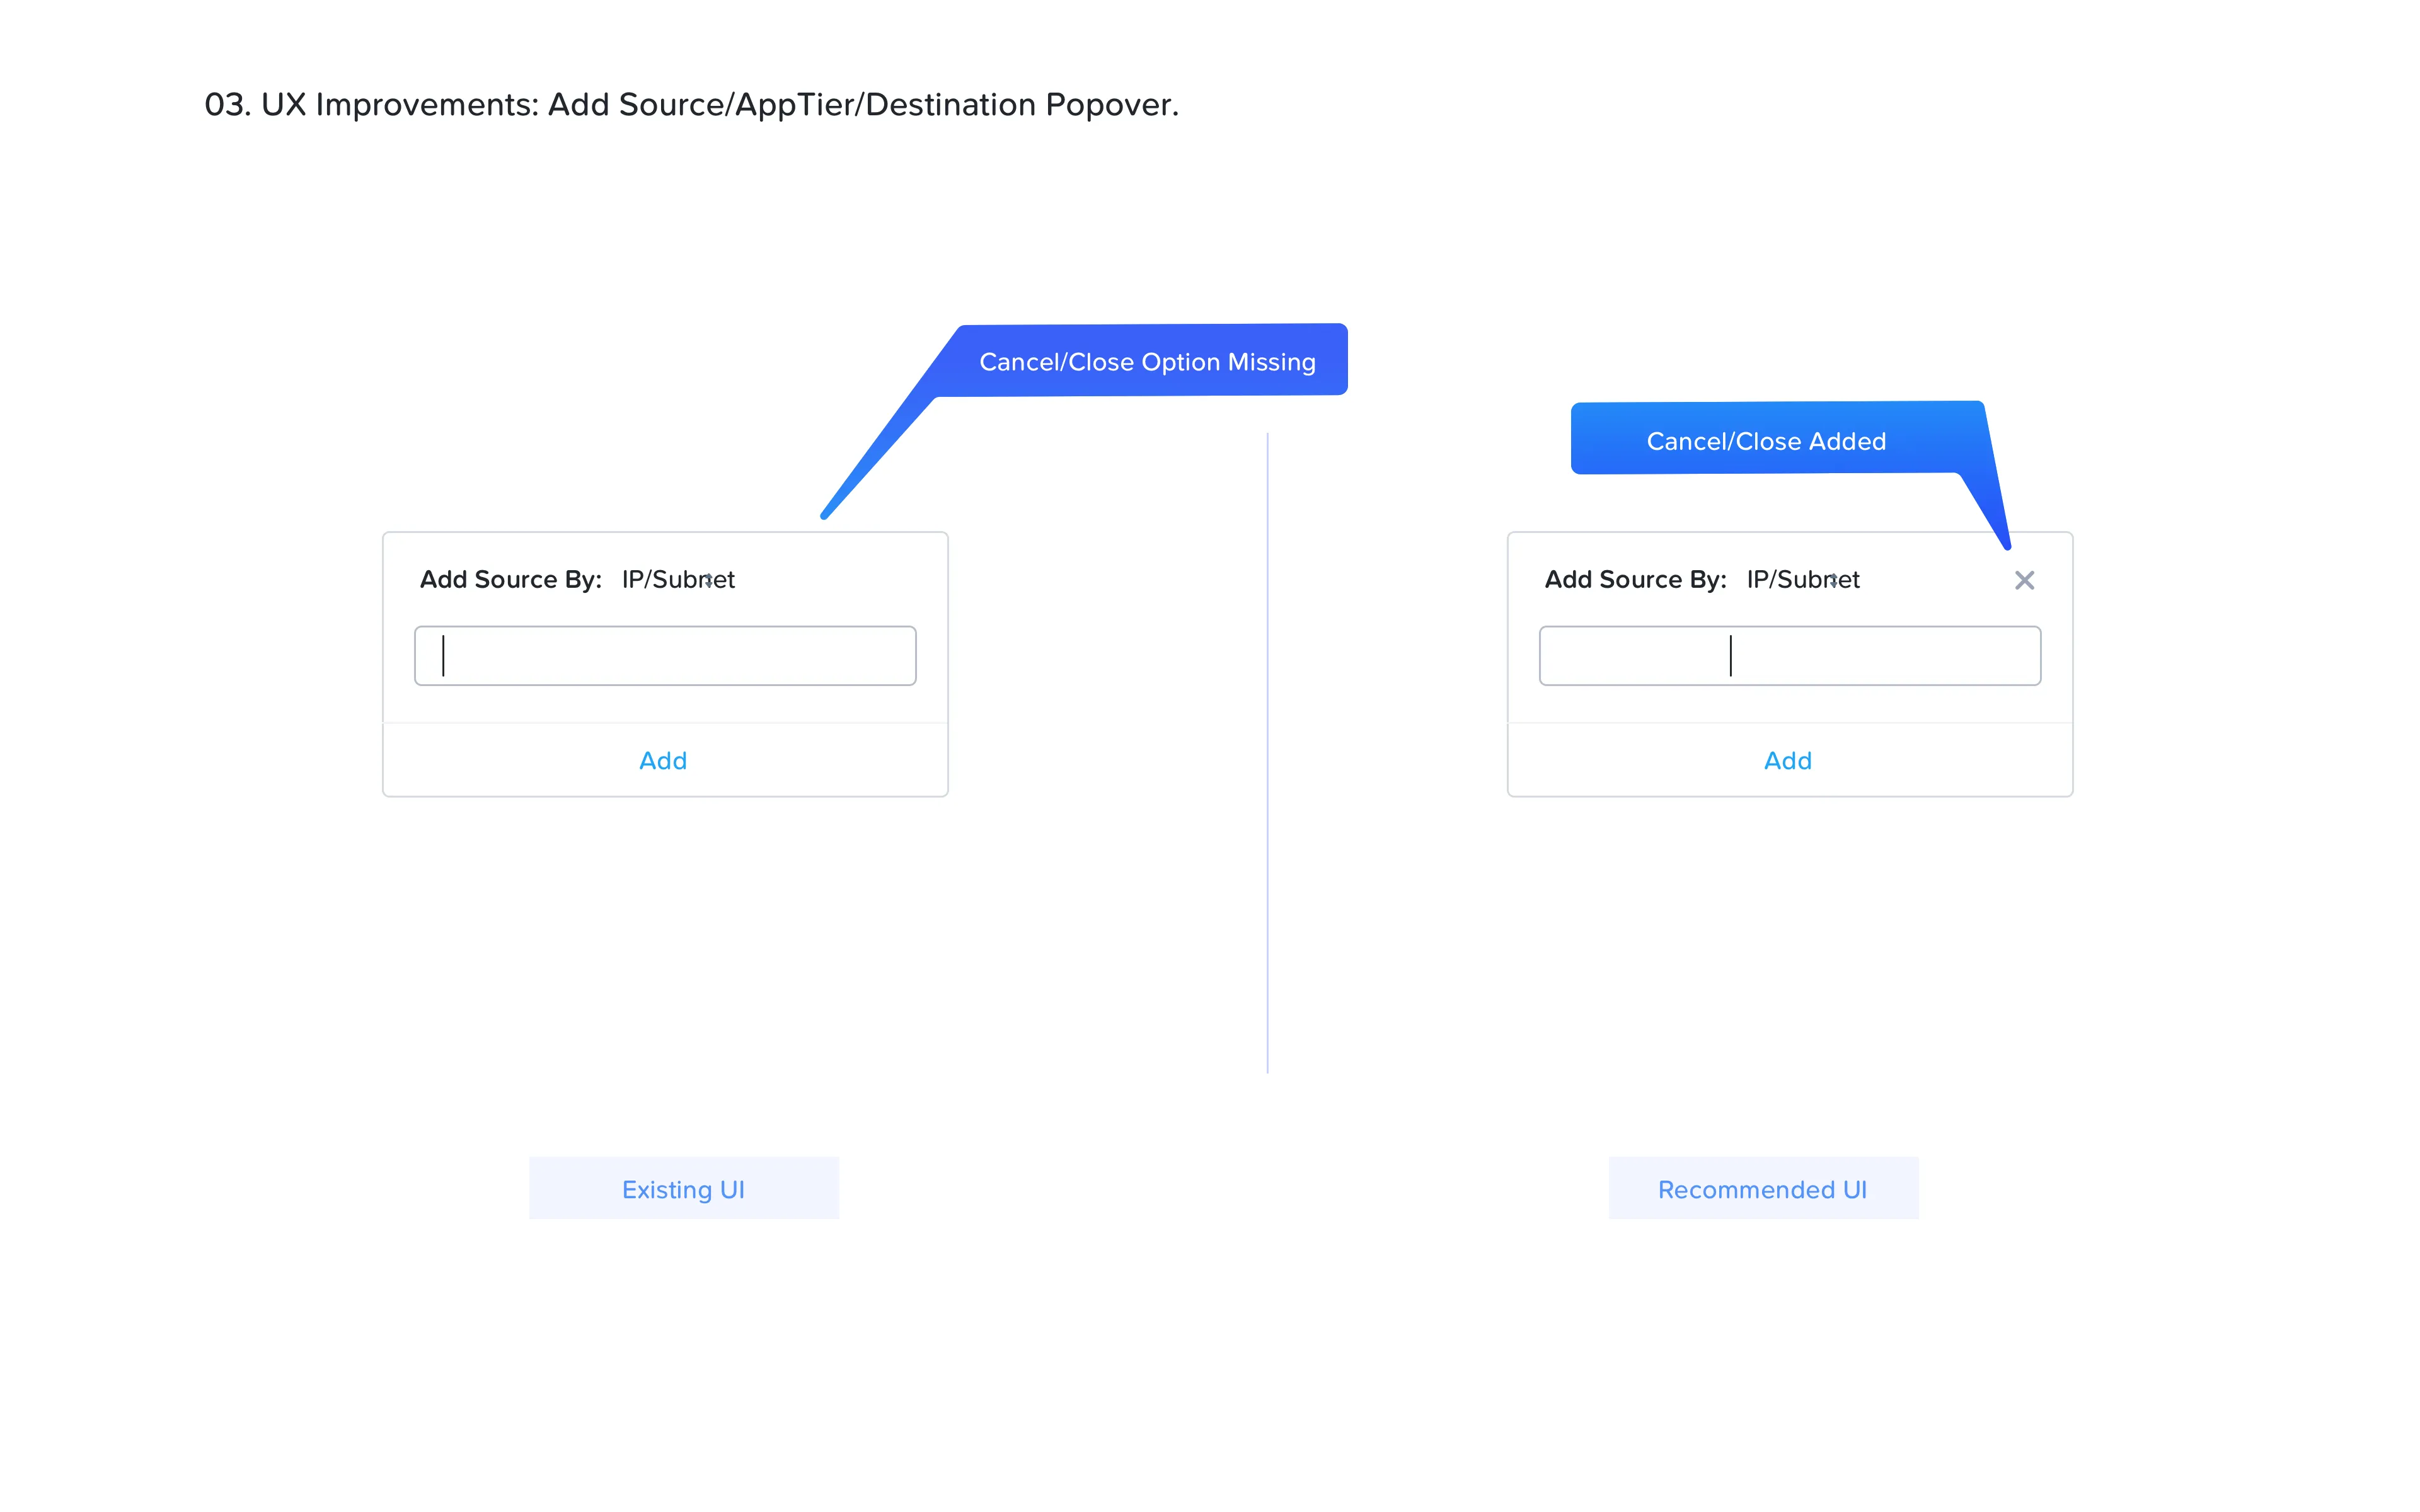
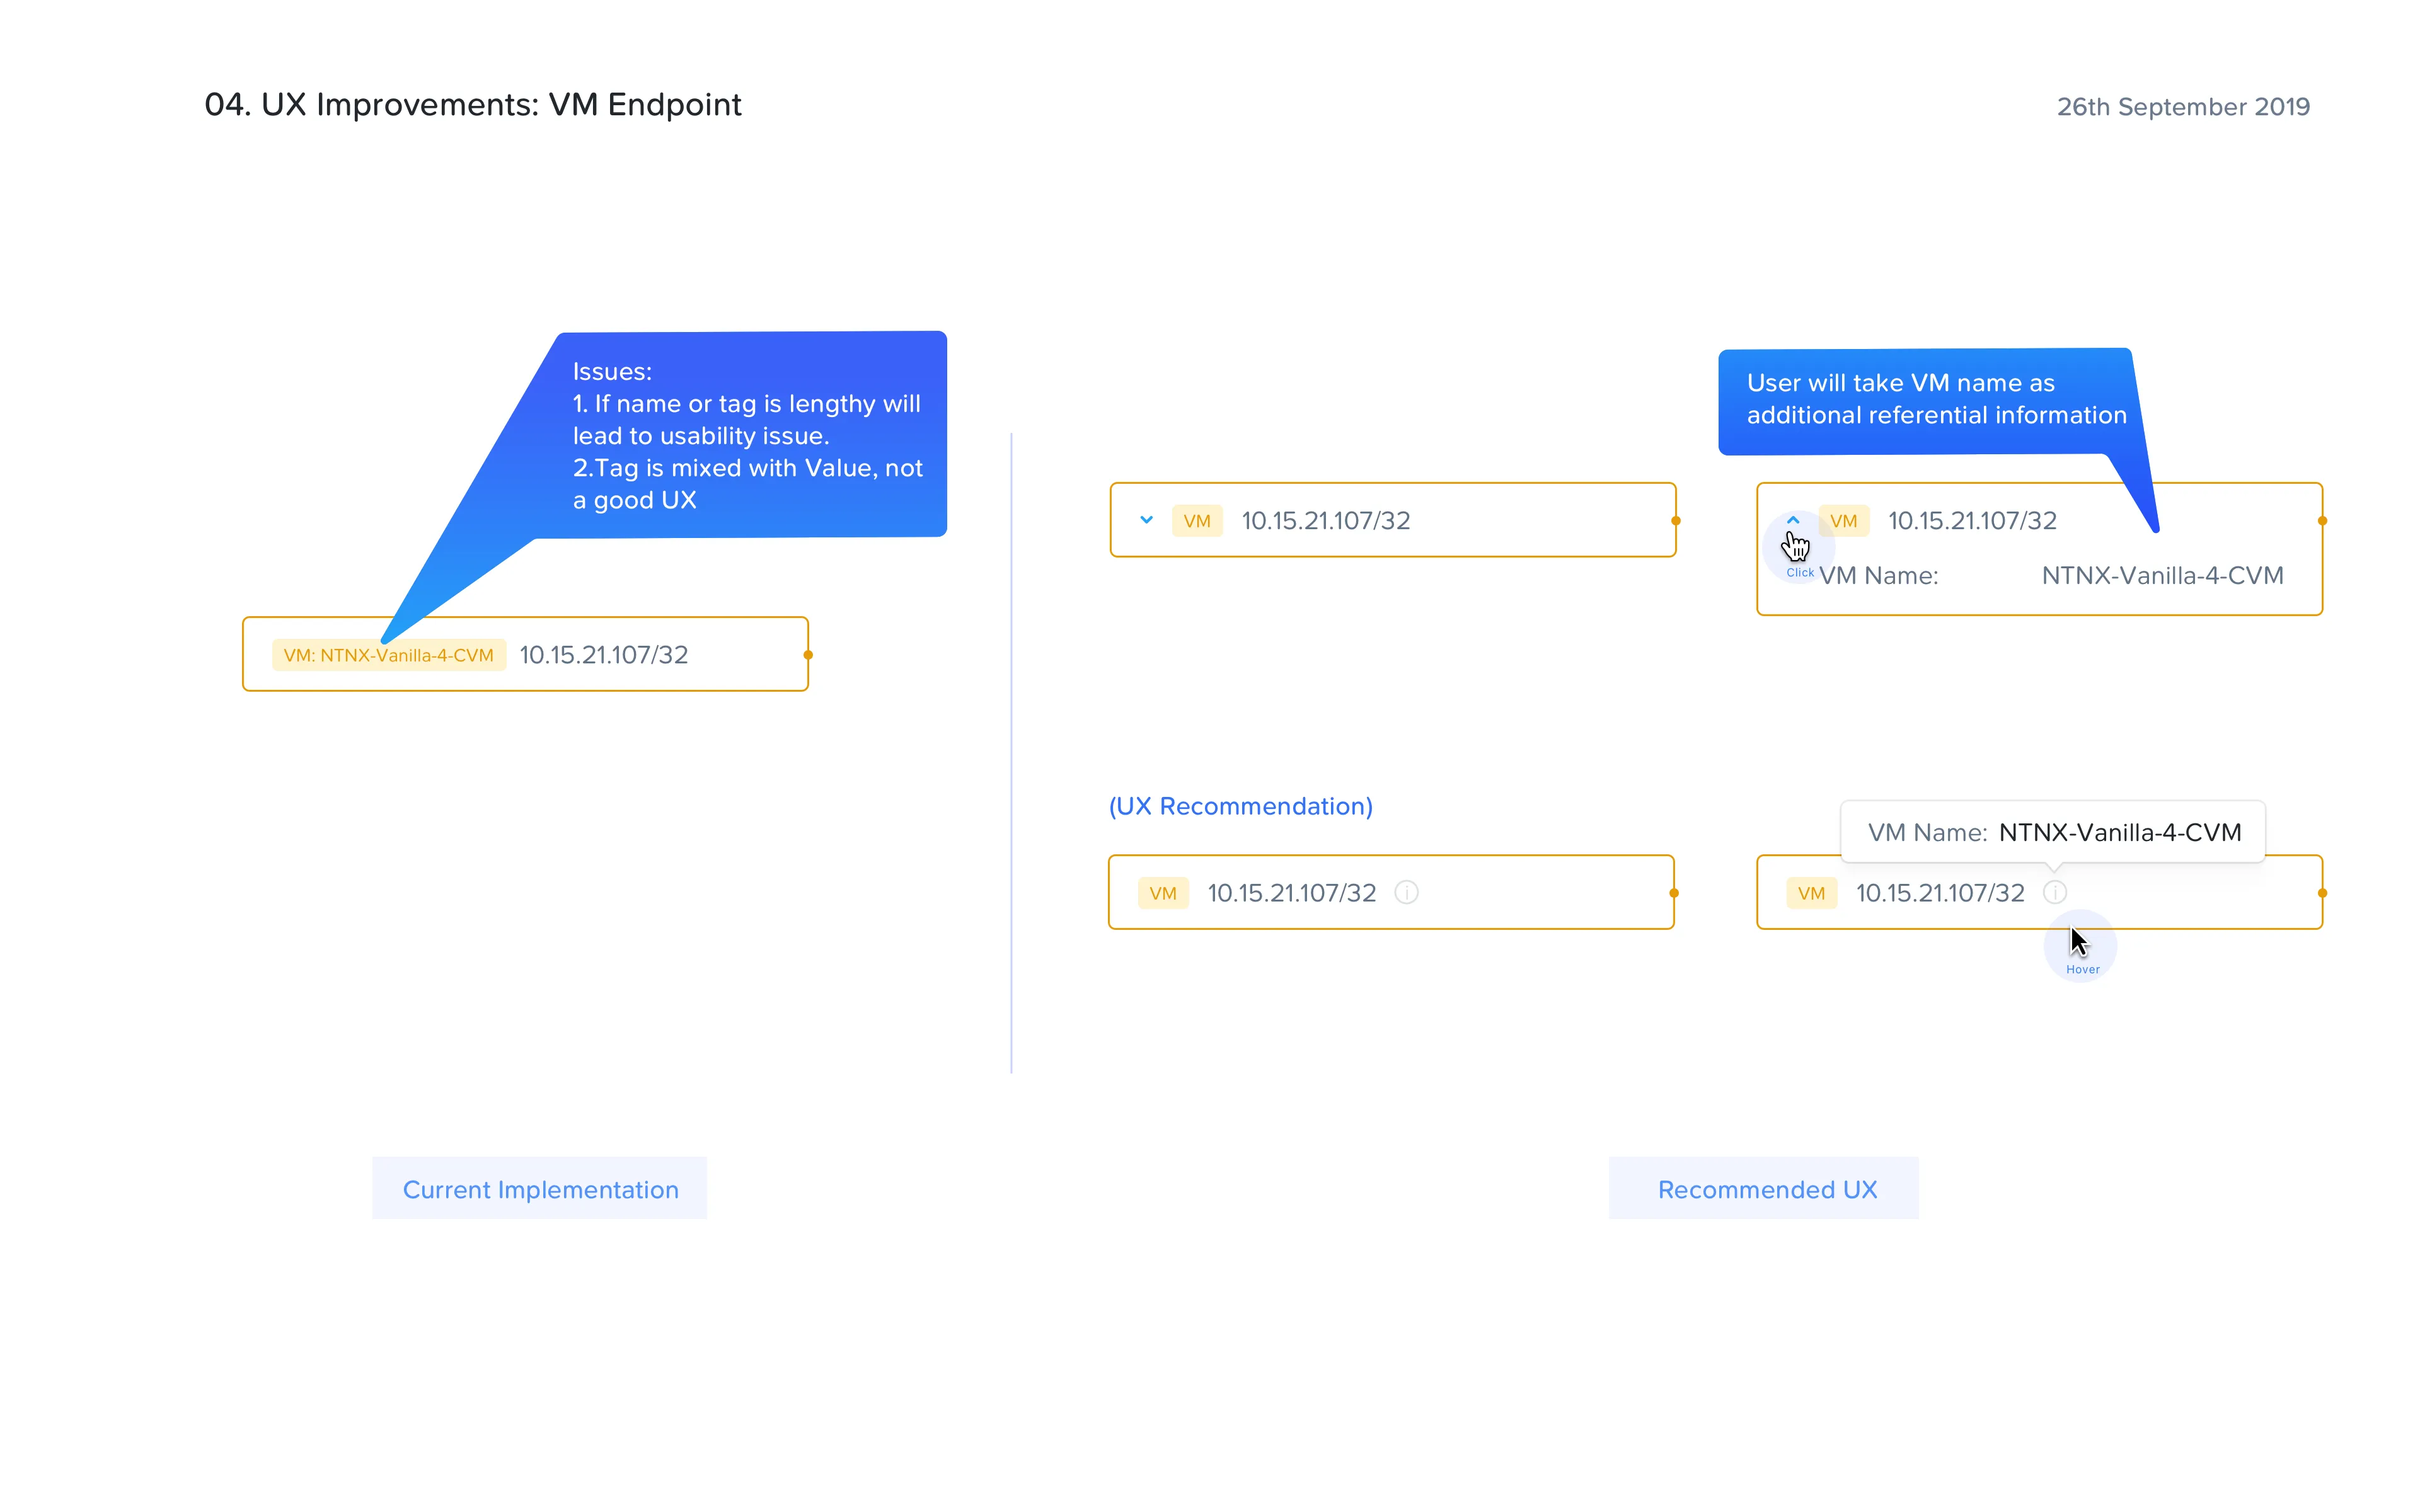
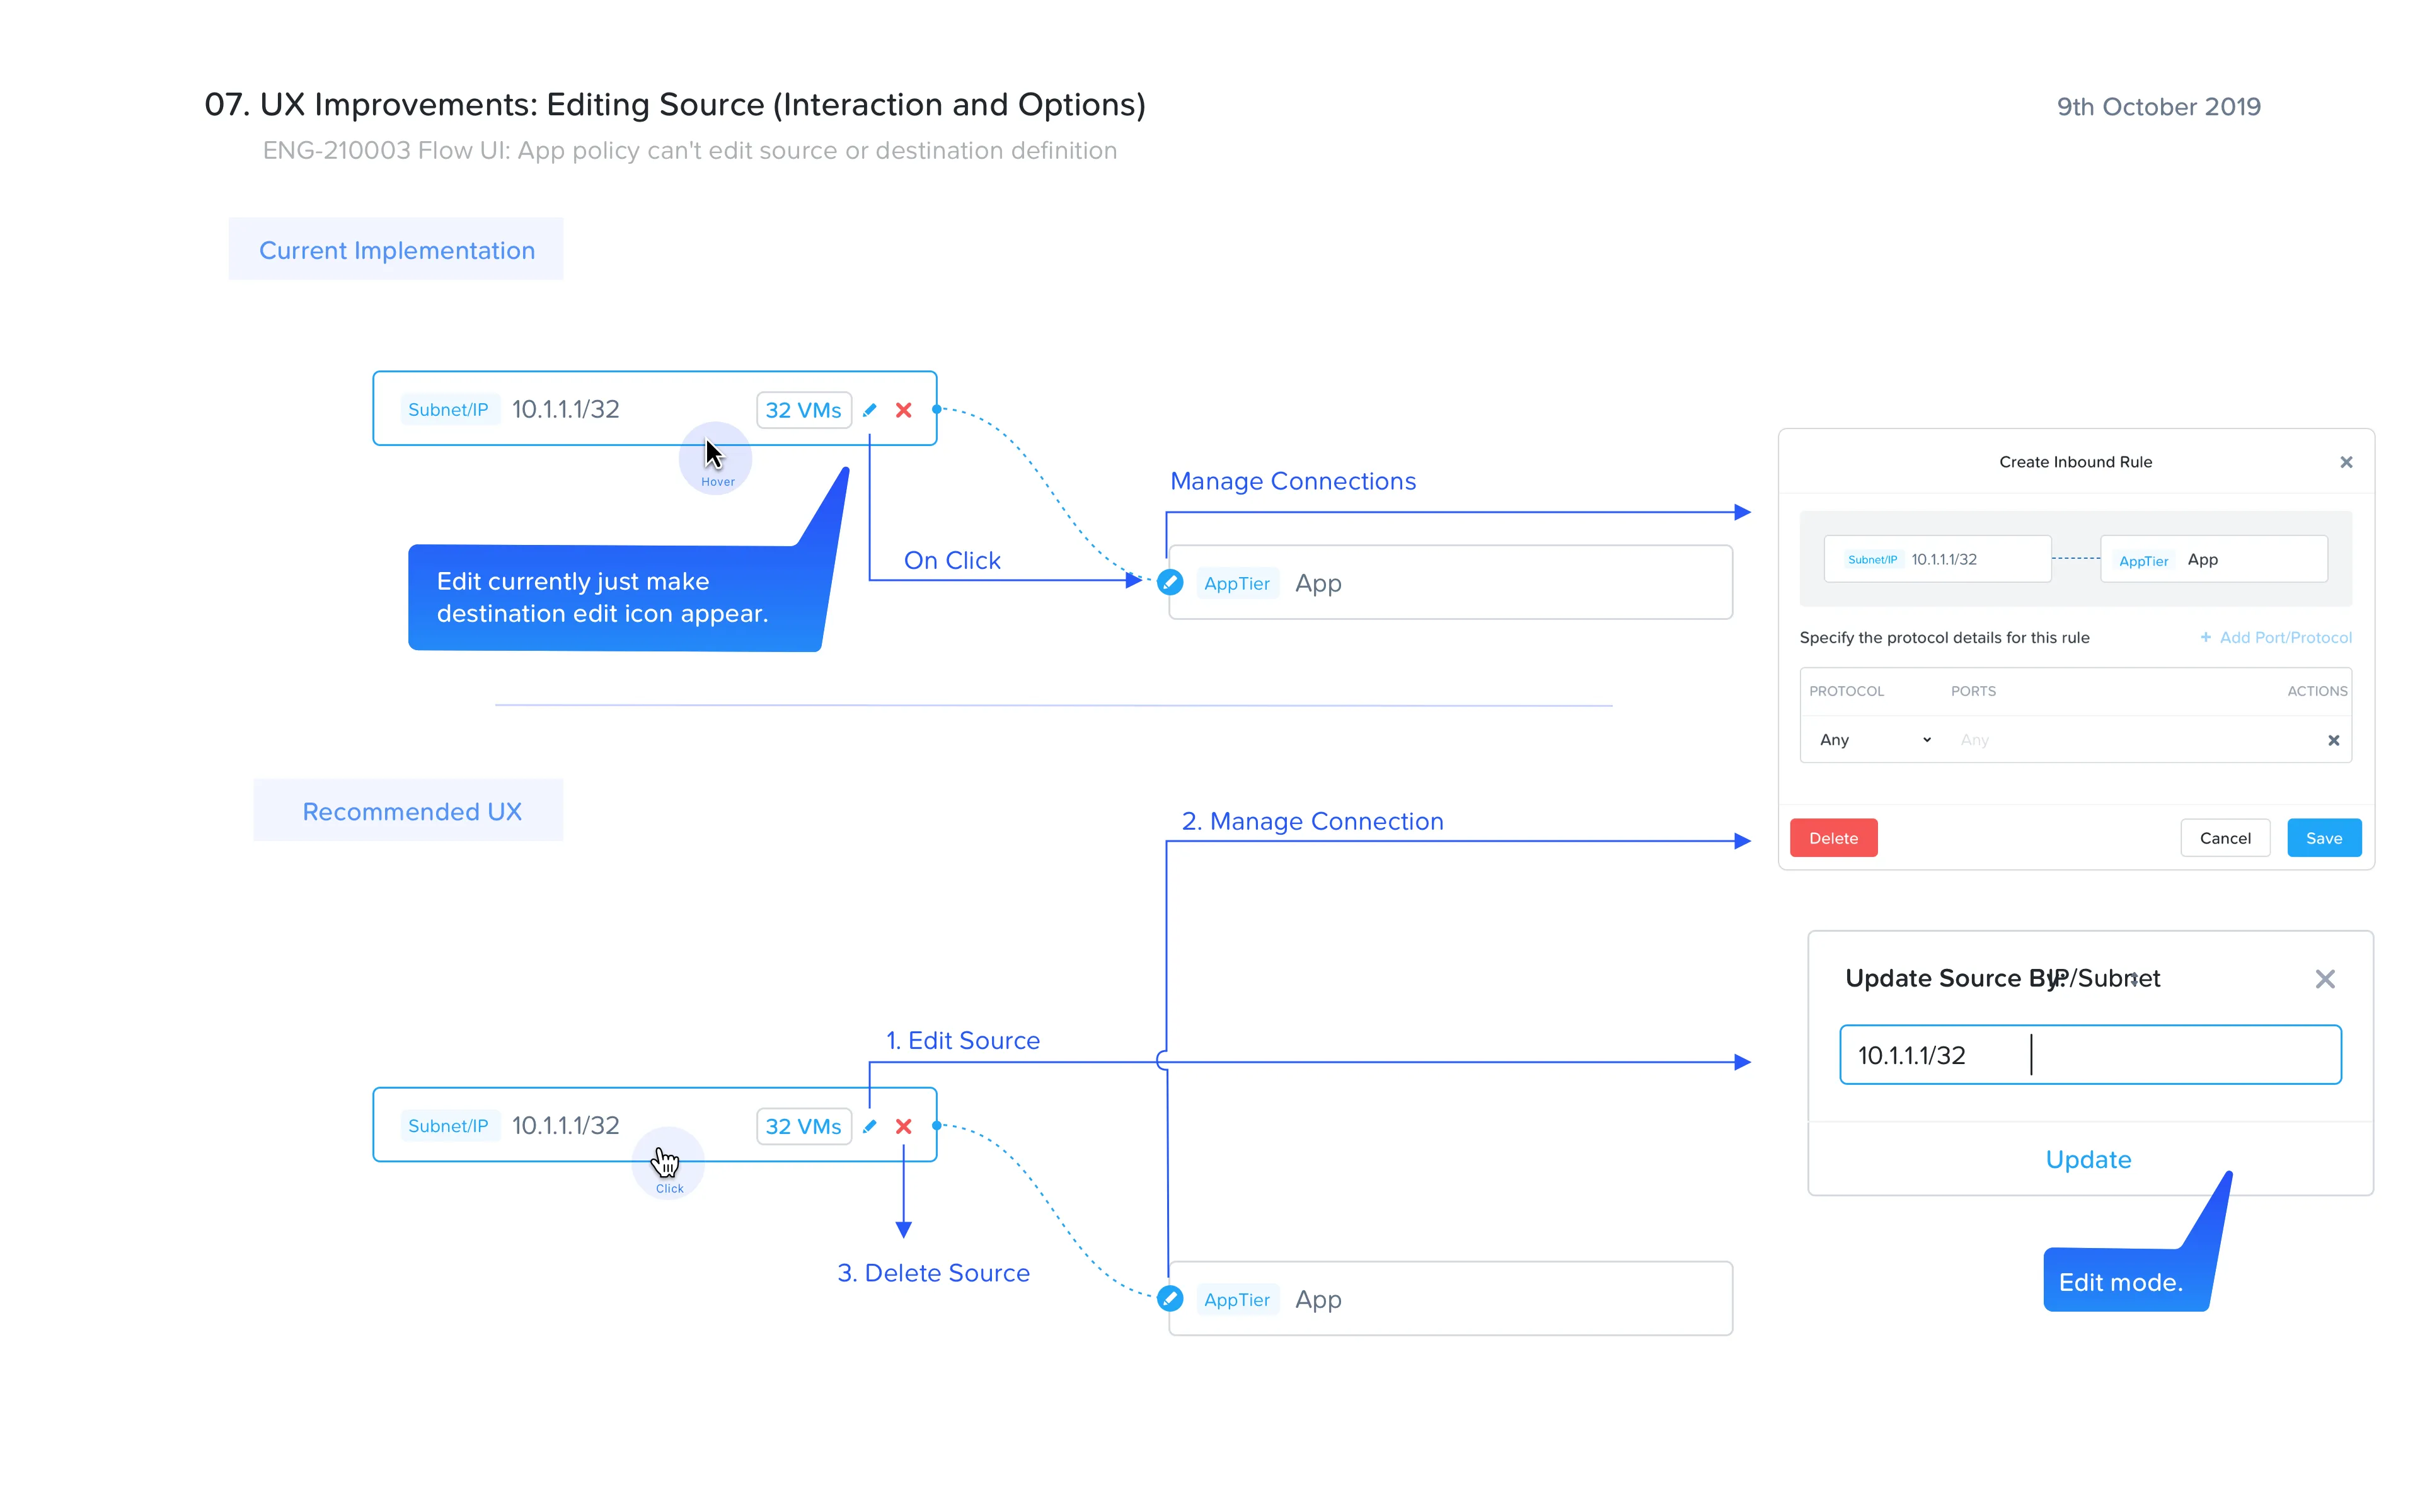
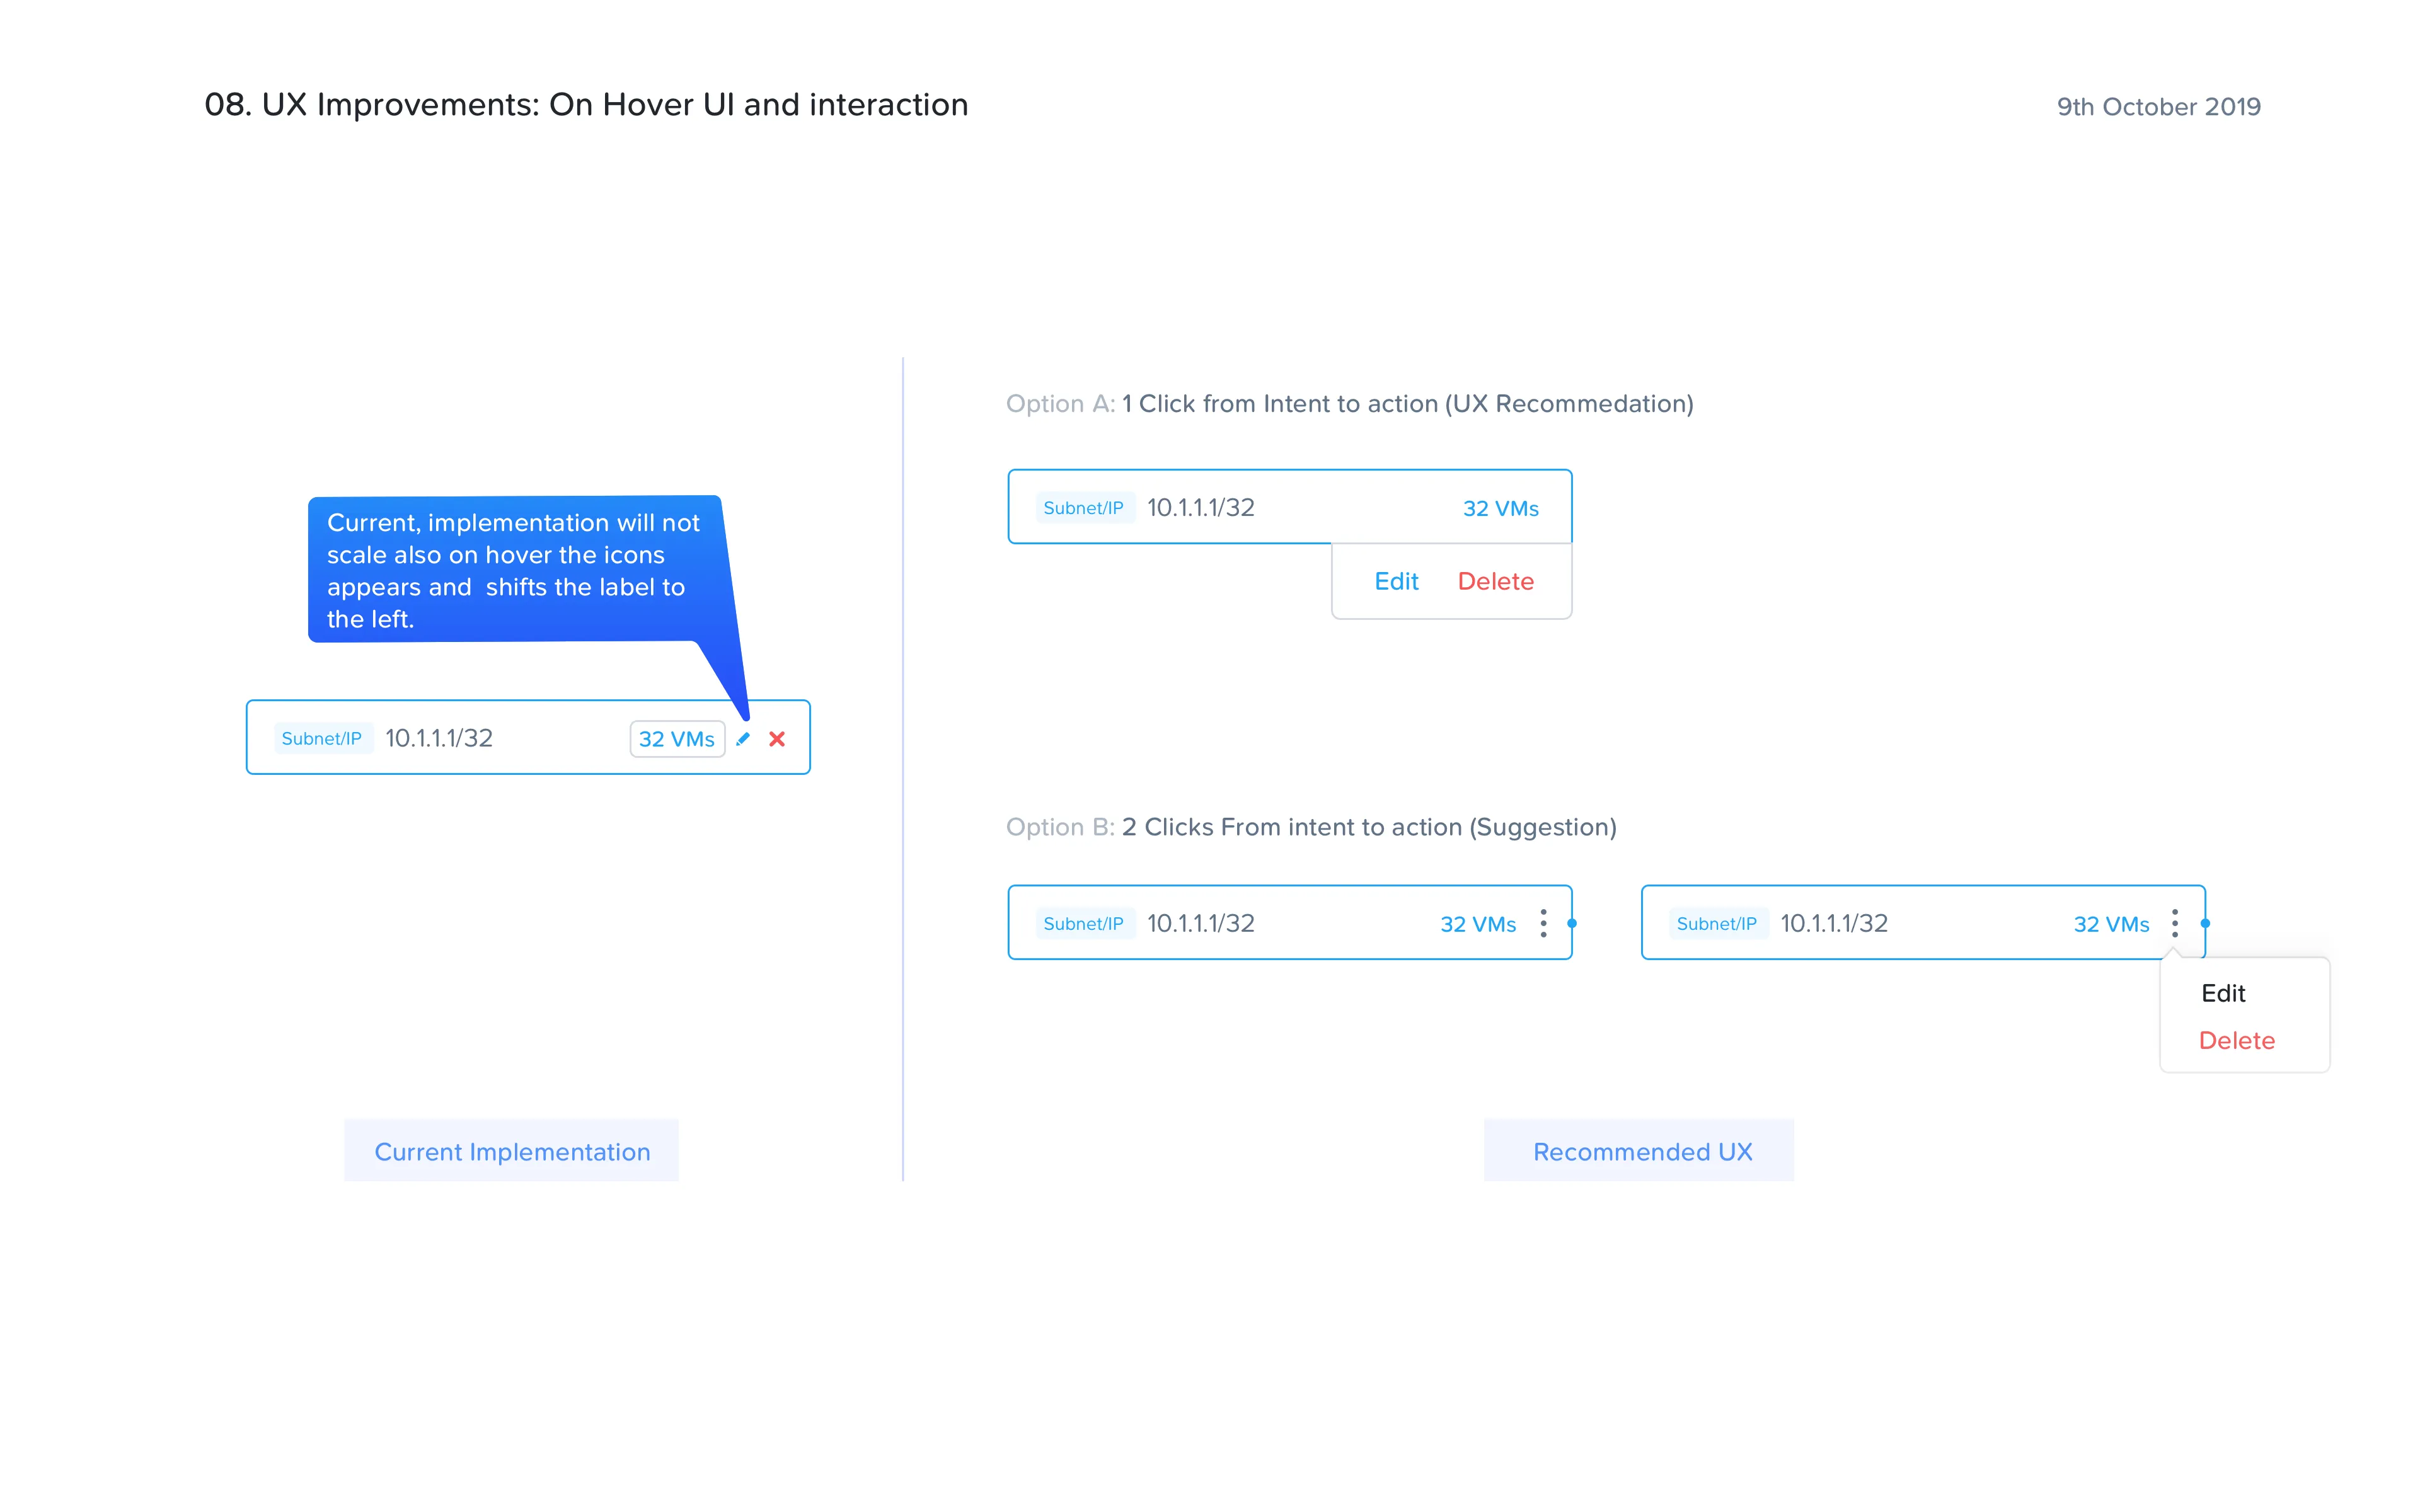
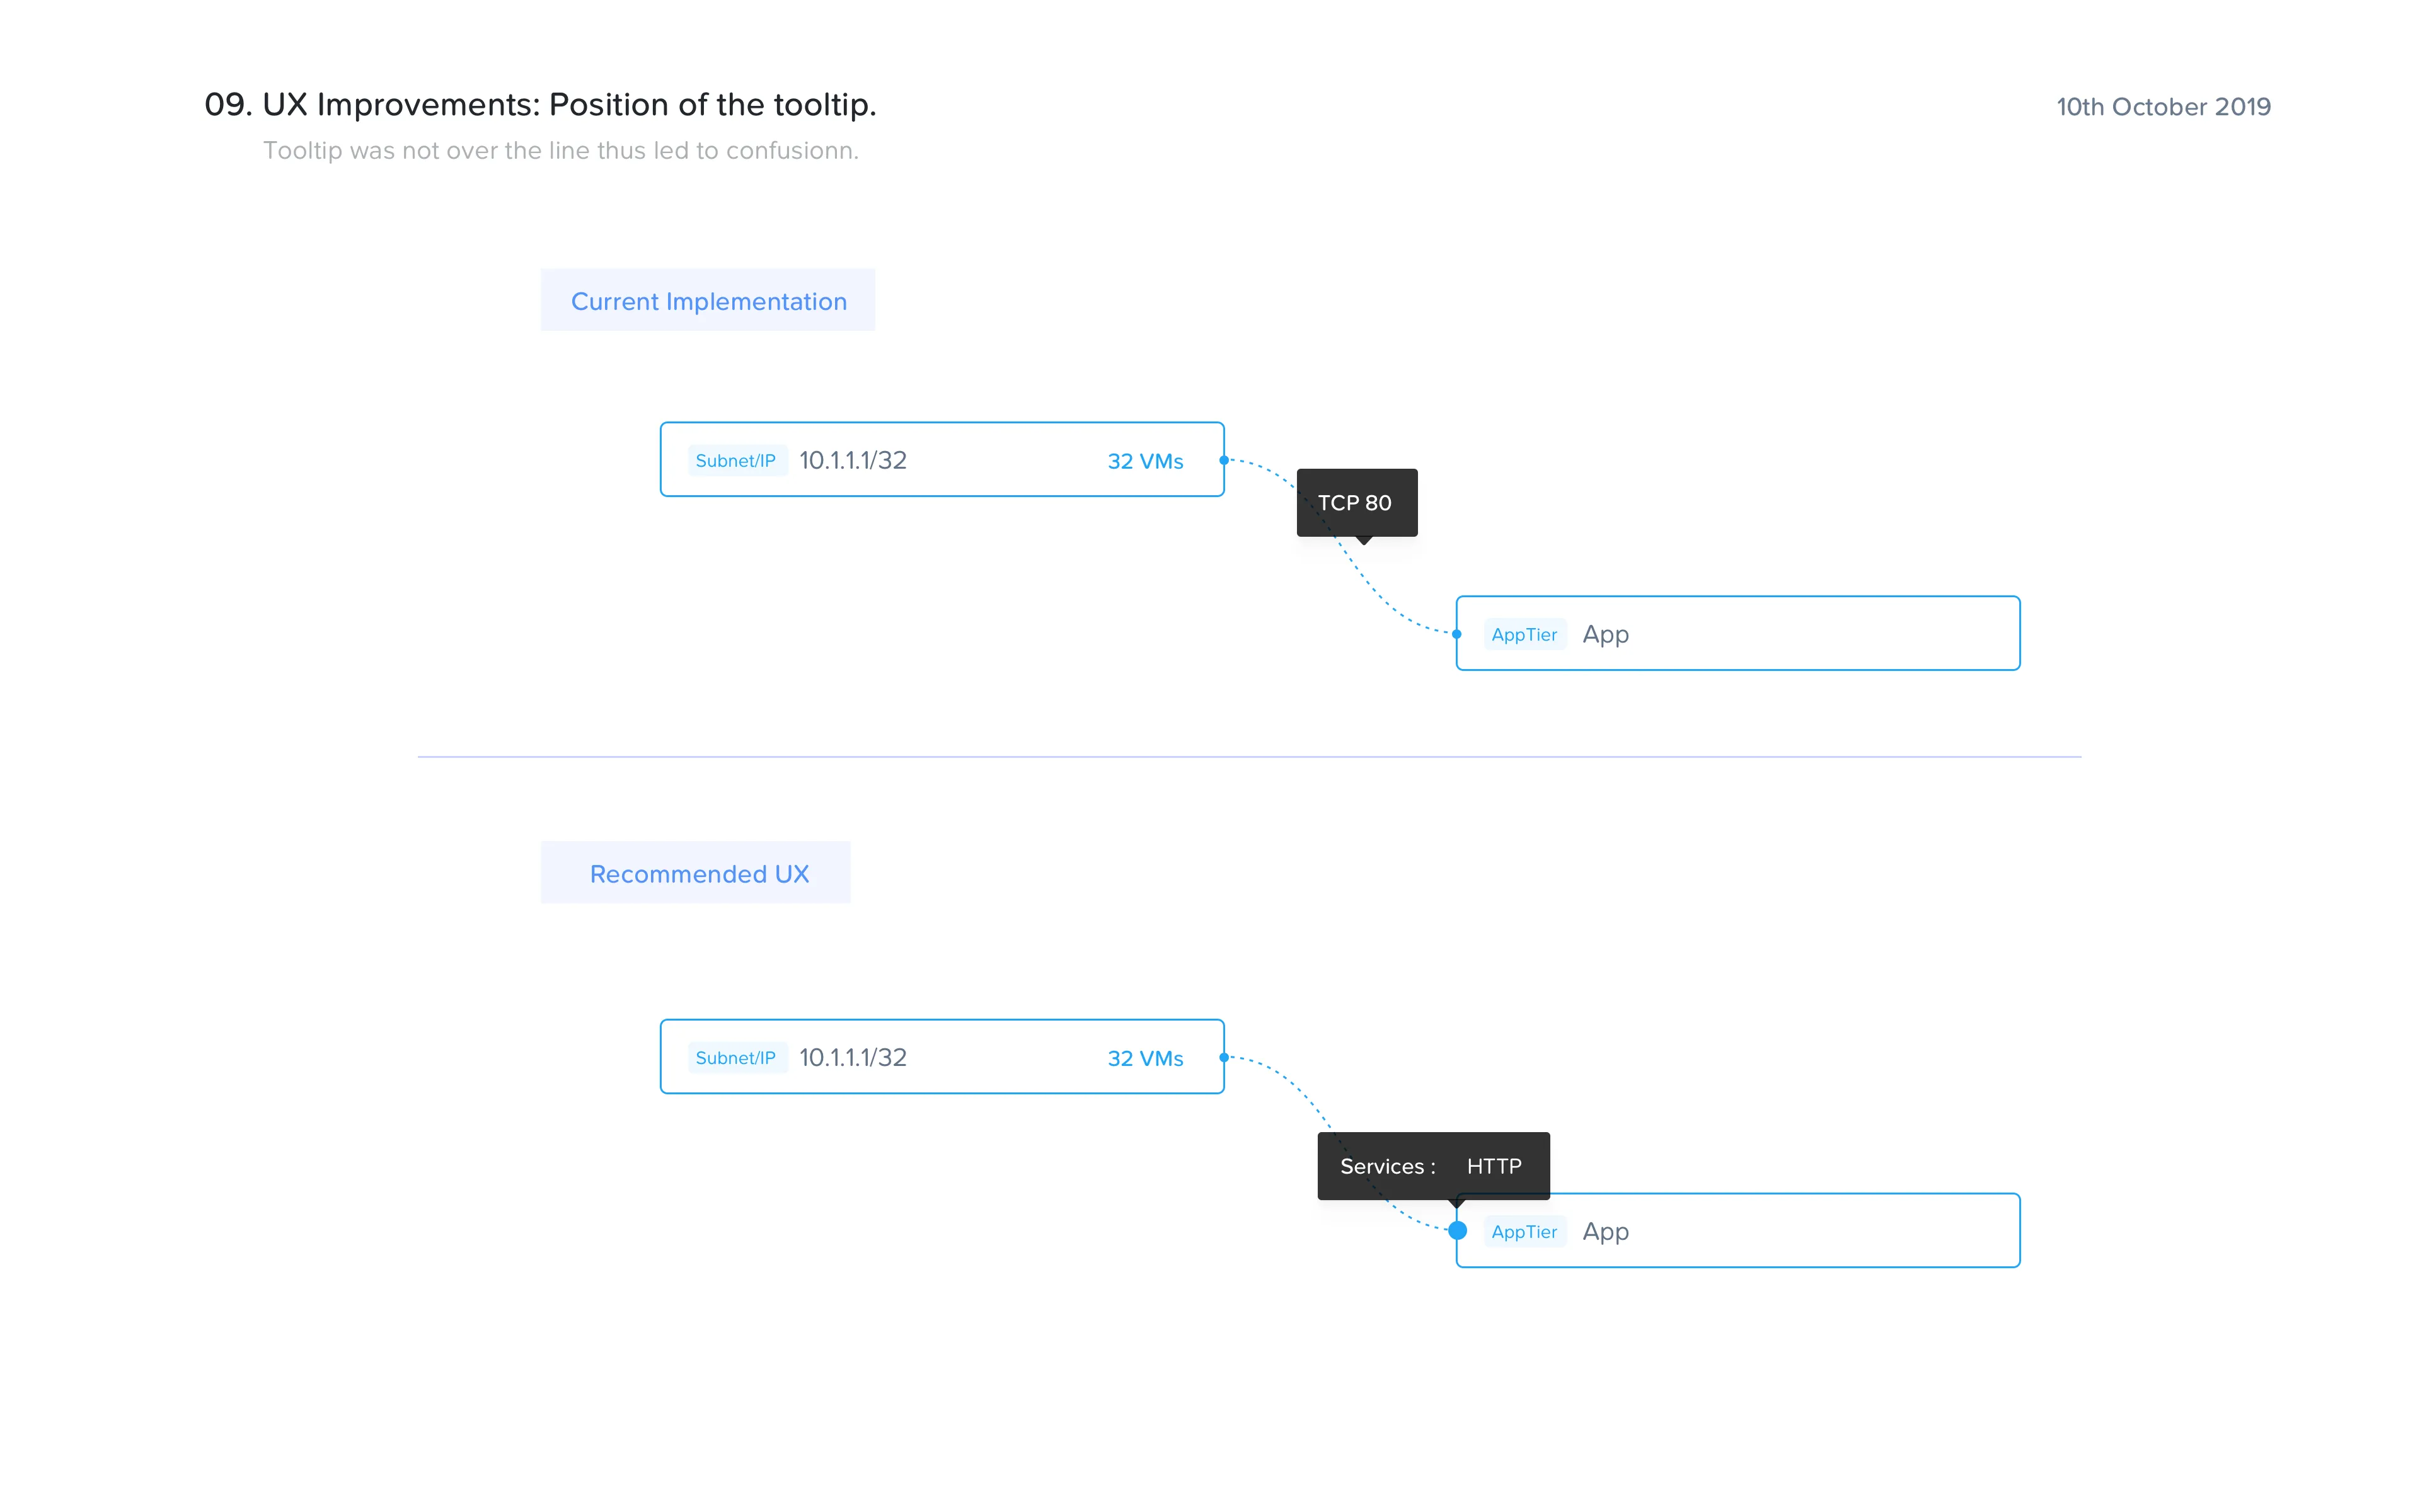
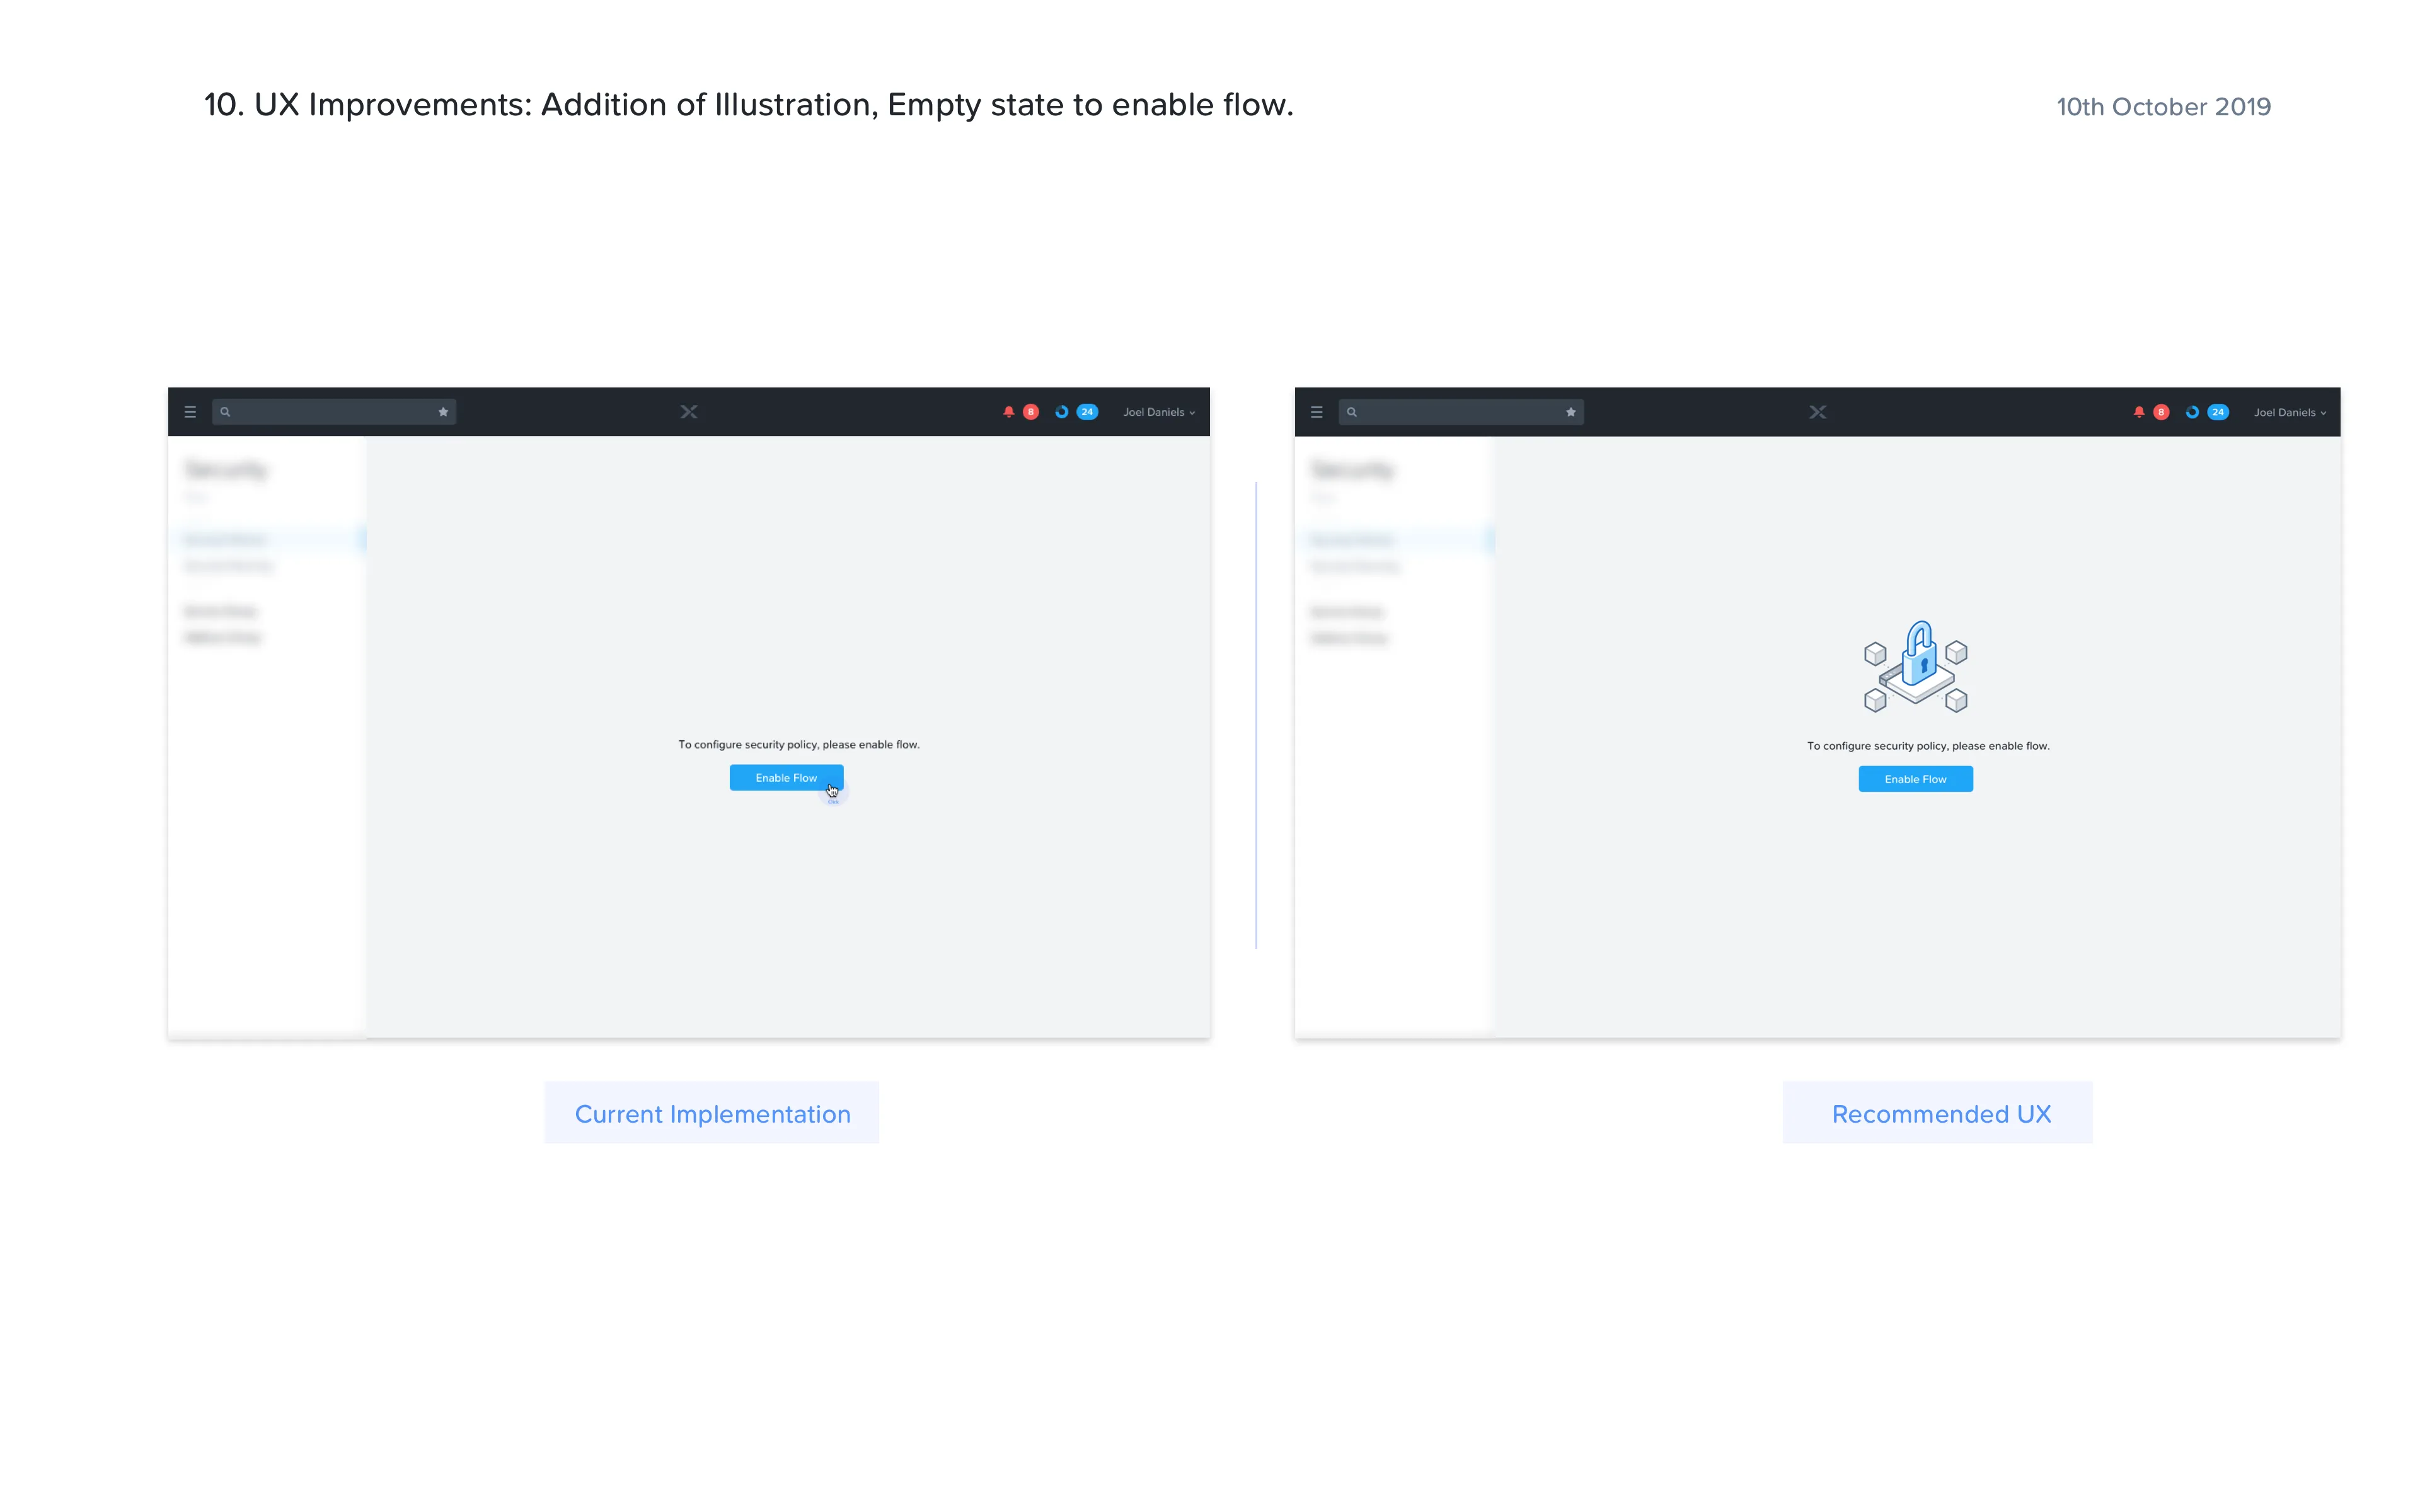
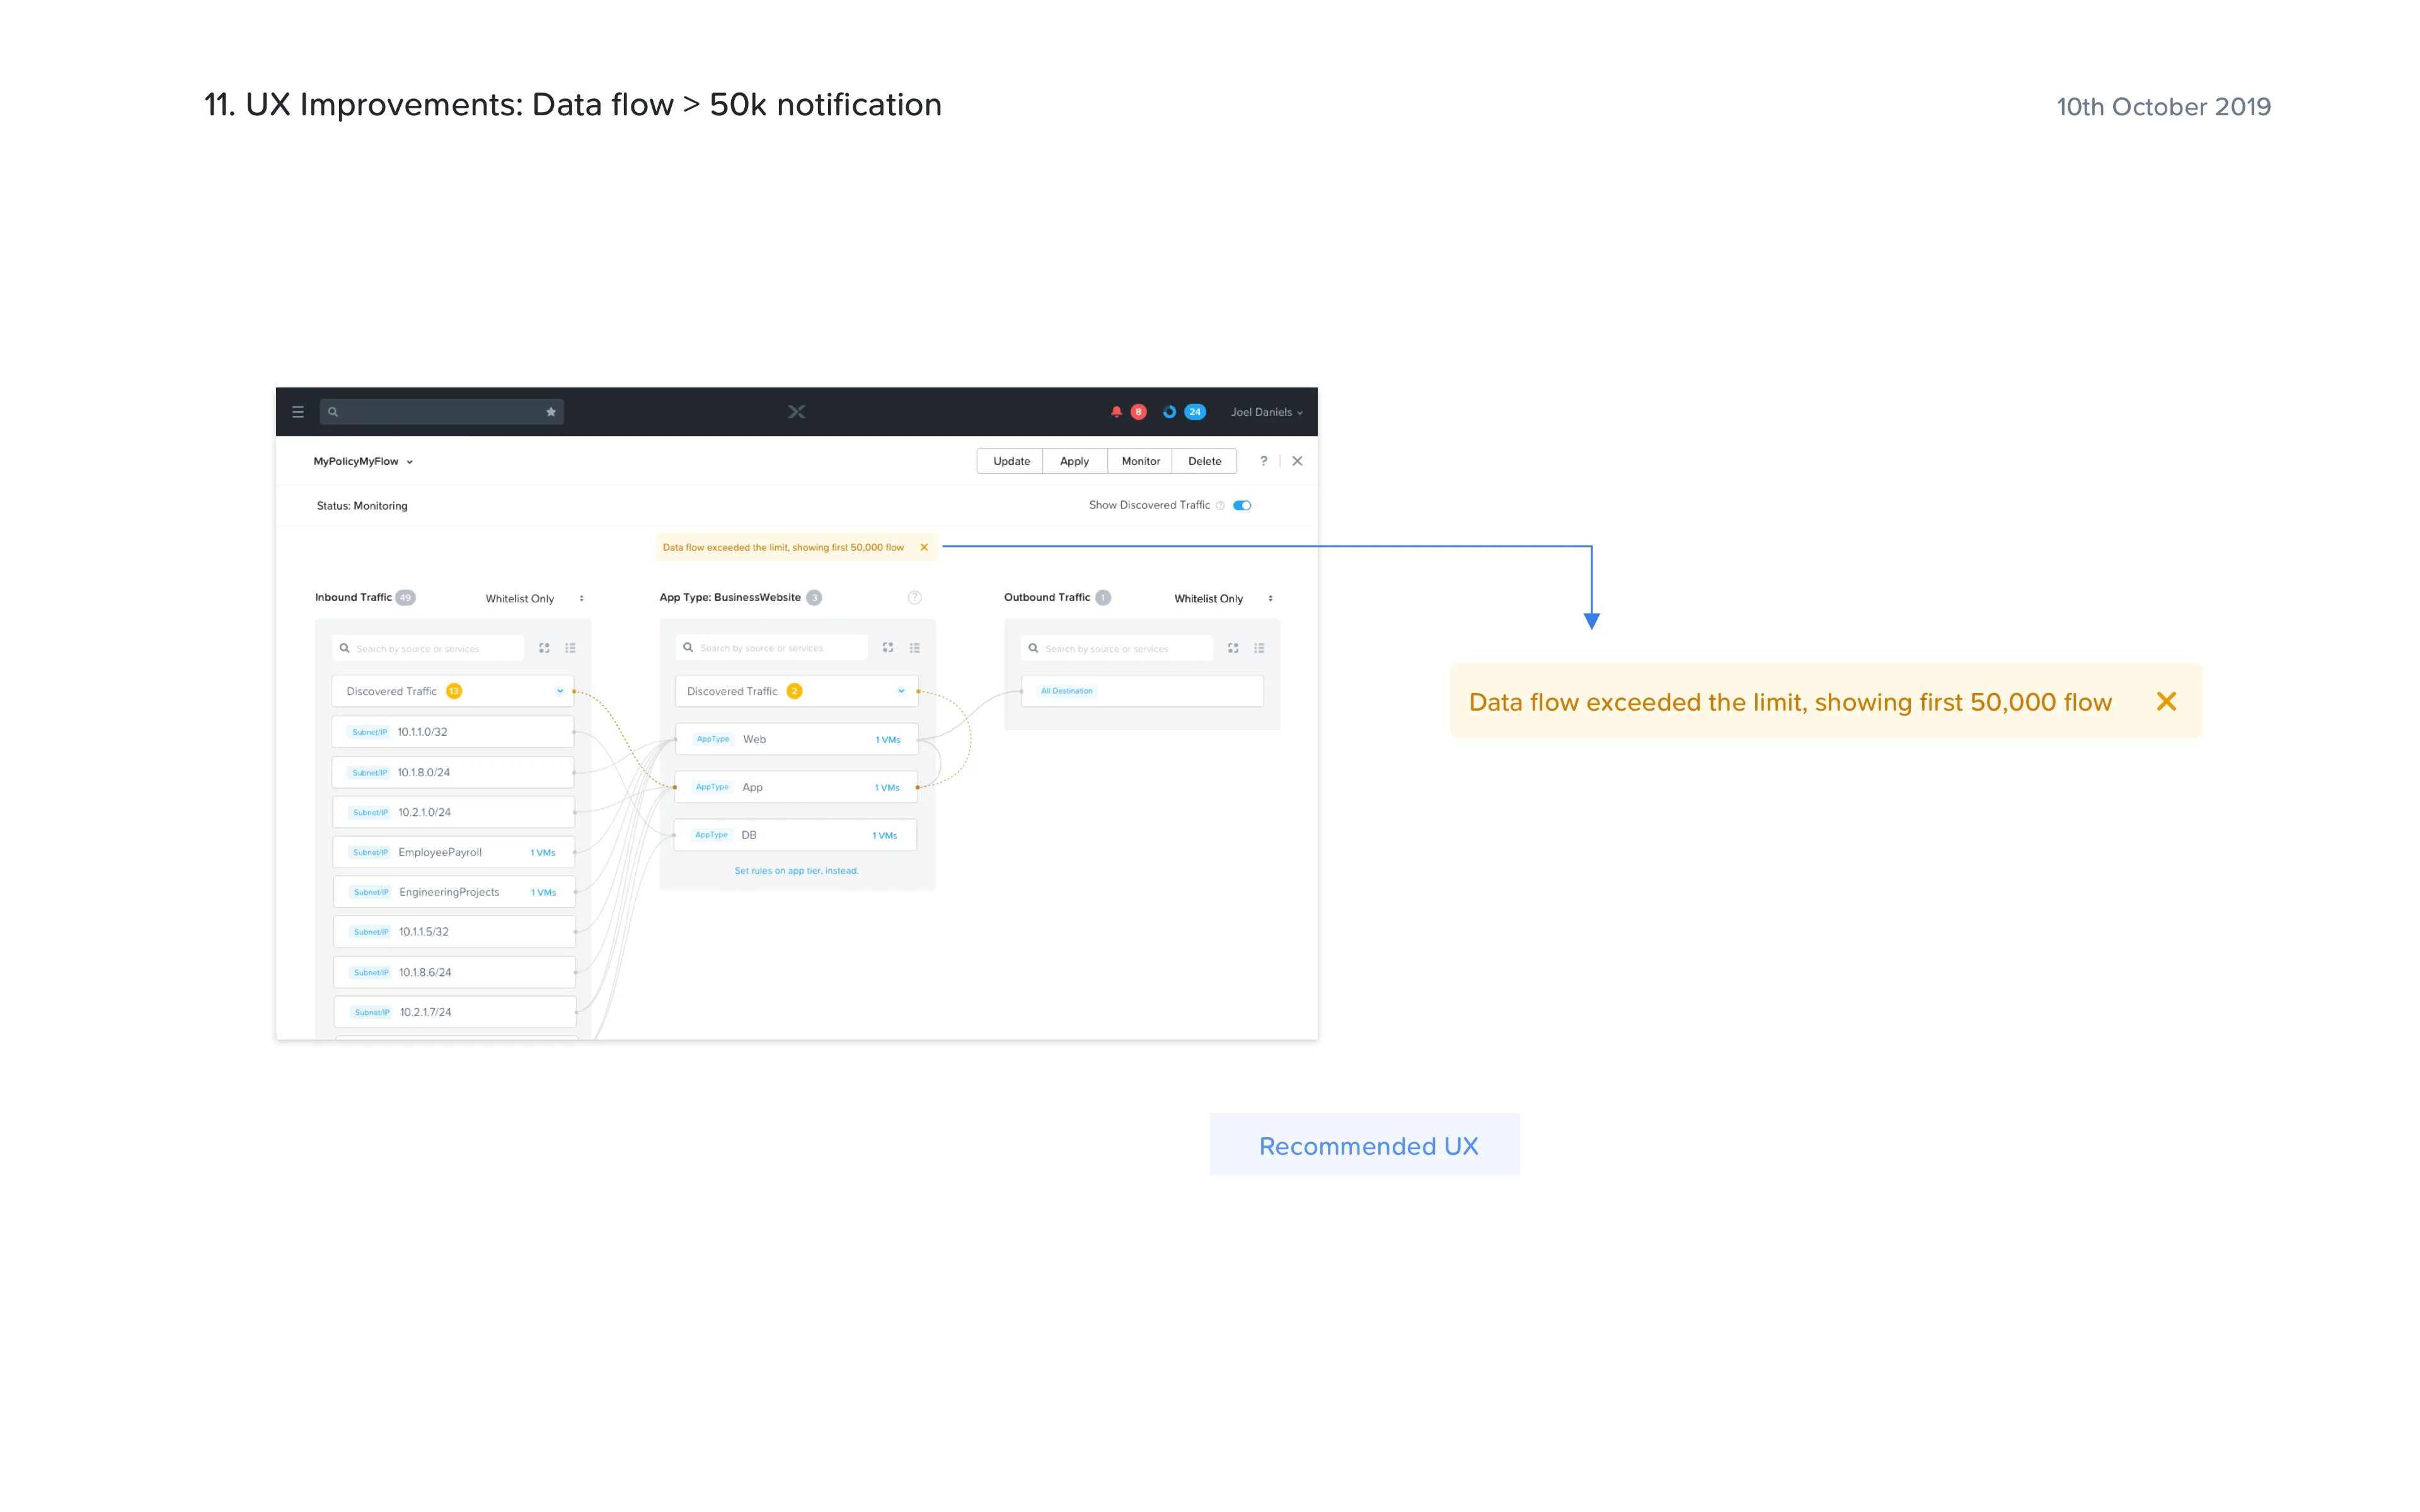
Nutanix Flow provides advanced network security for applications and data in private and public cloud environments. It allows you to easily create, visualize, and manage software-defined networks that isolate and protect your workloads from network threats, malware, and ransomware.
It also helps you to comply with regulatory standards and integrate with third-party network functions. Nutanix Flow provides a detailed visualization of communications between VMs and helps you to categorize and group workloads for setting the right network policies
03 Project Overview: Nutanix Flow
Nutanix Flow is a product that provides advanced network security for applications and data in private and public cloud environments. Nutanix Flow provides a detailed visualization of communications between VMs and helps you to categorize and group workloads for setting the right network policies.
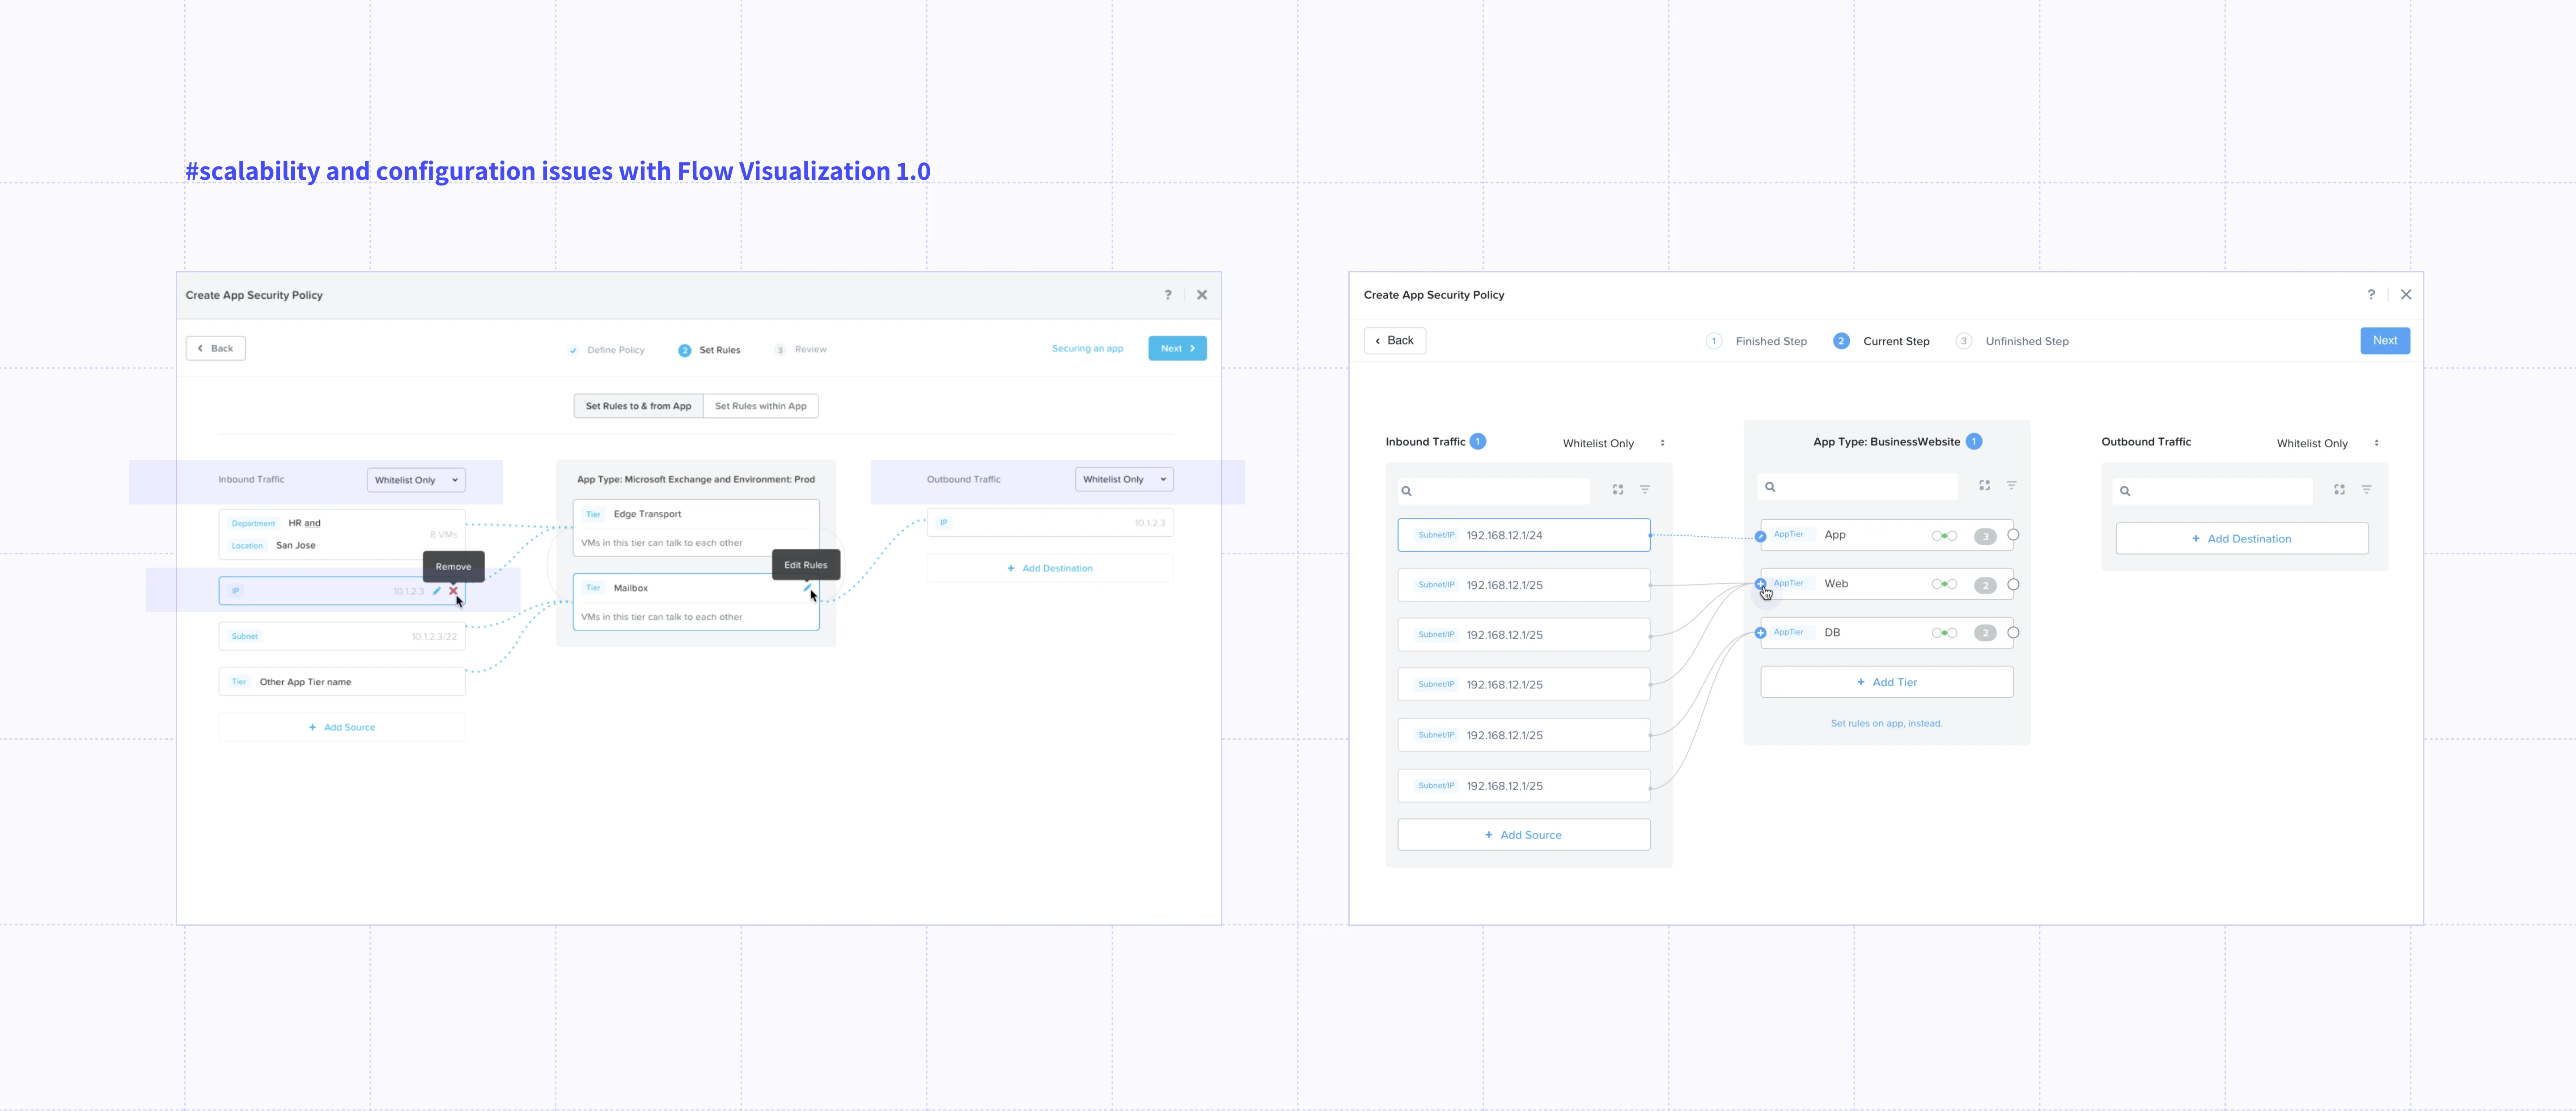
Solution
SaaS web interface with redesigned visualization addressing scale and usability
Role
Data Visualization & Experience Designer
Contribution
Lead, UX Flows, Data Visualization
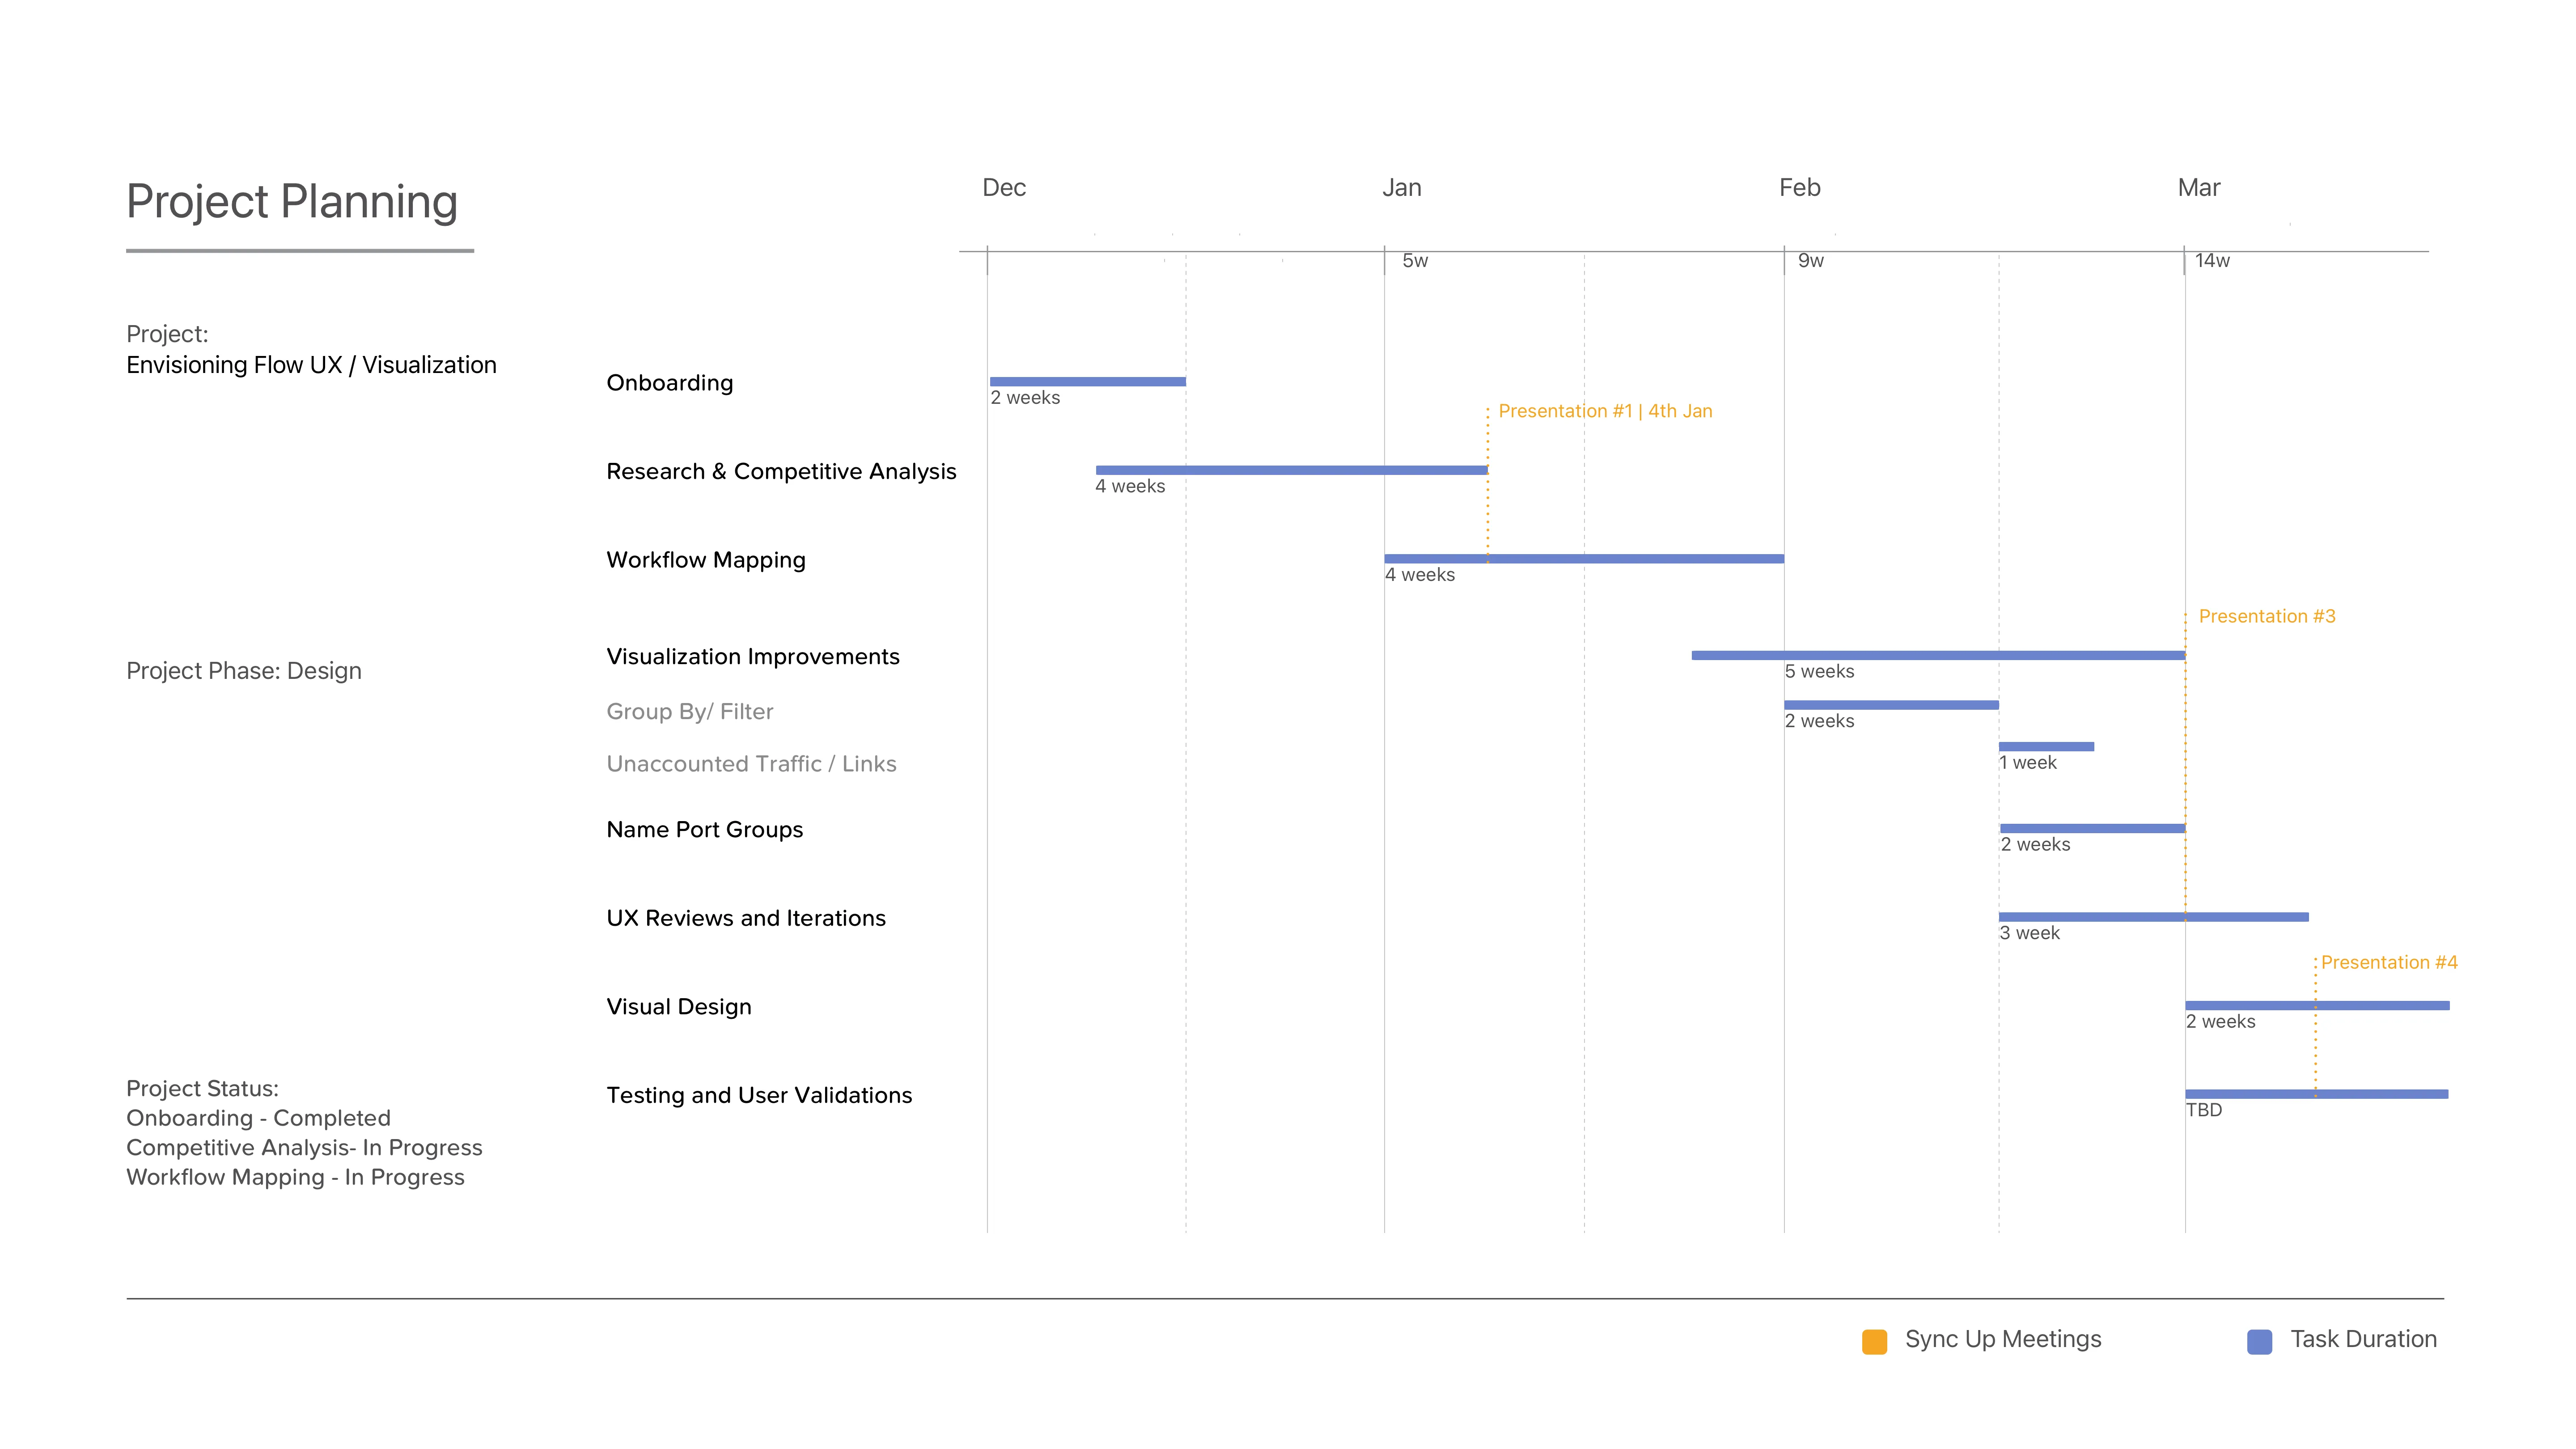
Project Duration:
8-12 months
Project Status
In Production
Security offering on Nutanix
Centralized management with distributed enforcement
Application centric policy management
Monitoring, visualization and automation
Distributed stateful firewalls


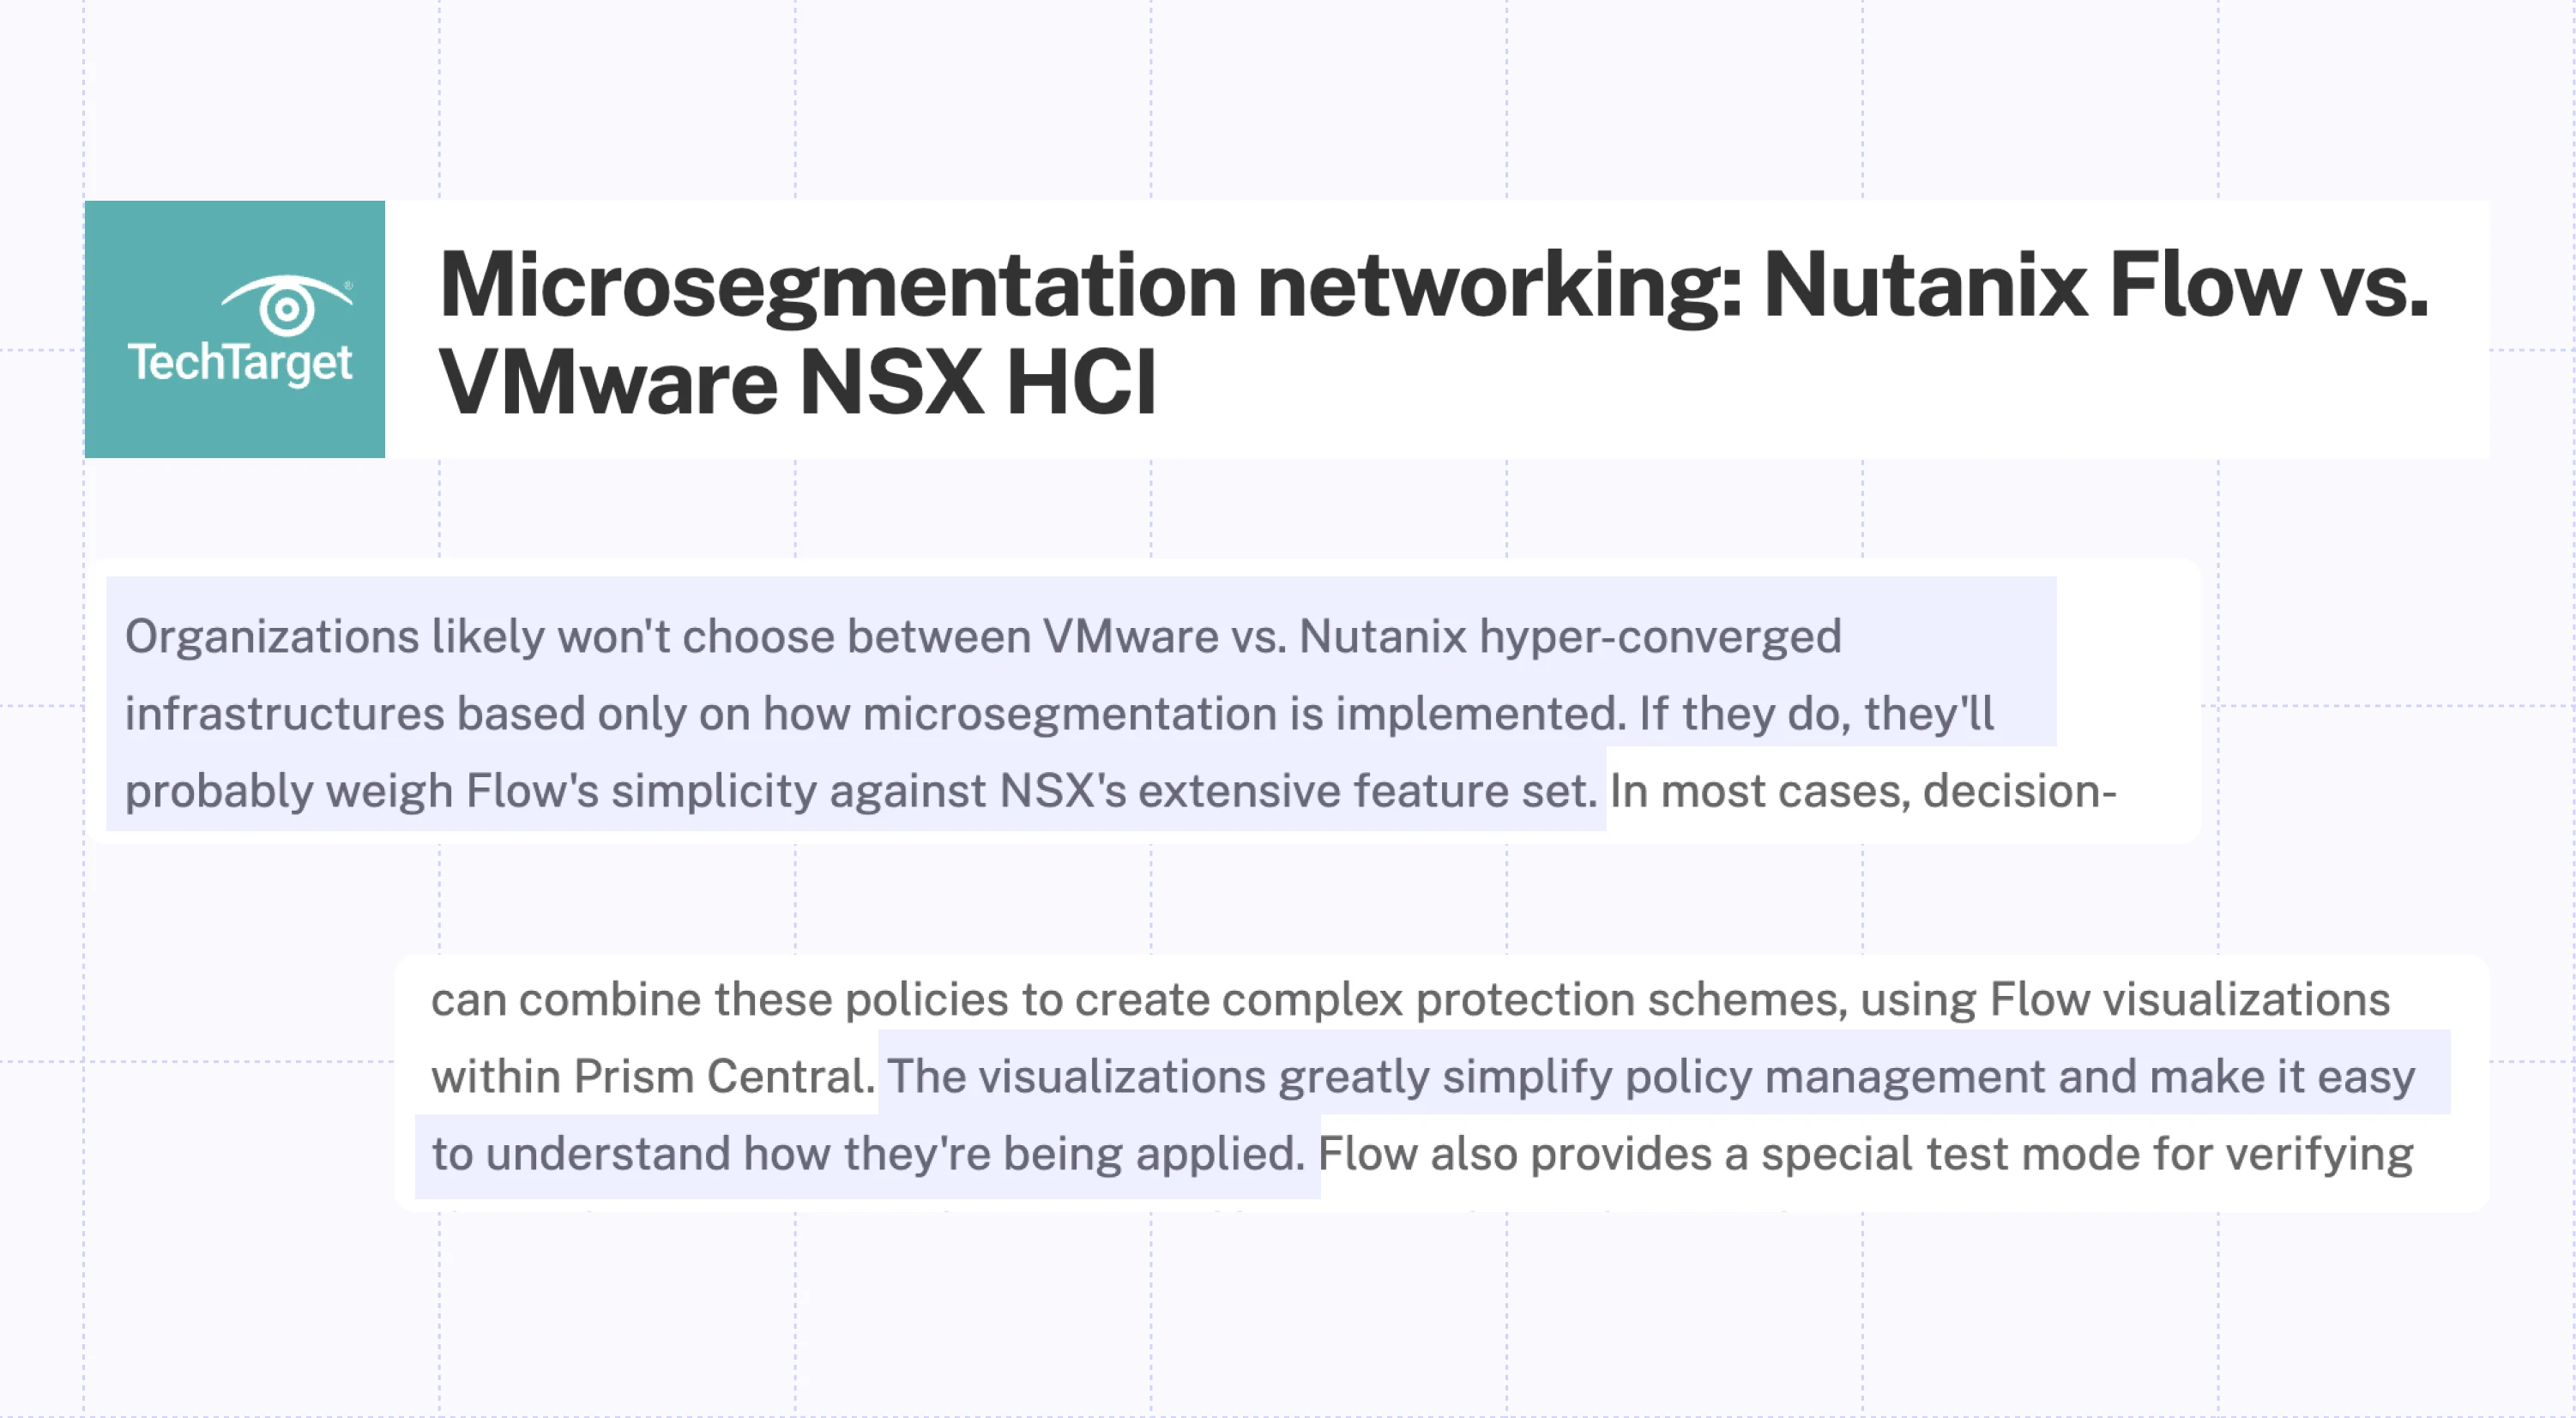
Featured in TechTarget
The improvement in the simplicity of configuration and visualization was featured in TechTarget Nov 2020.
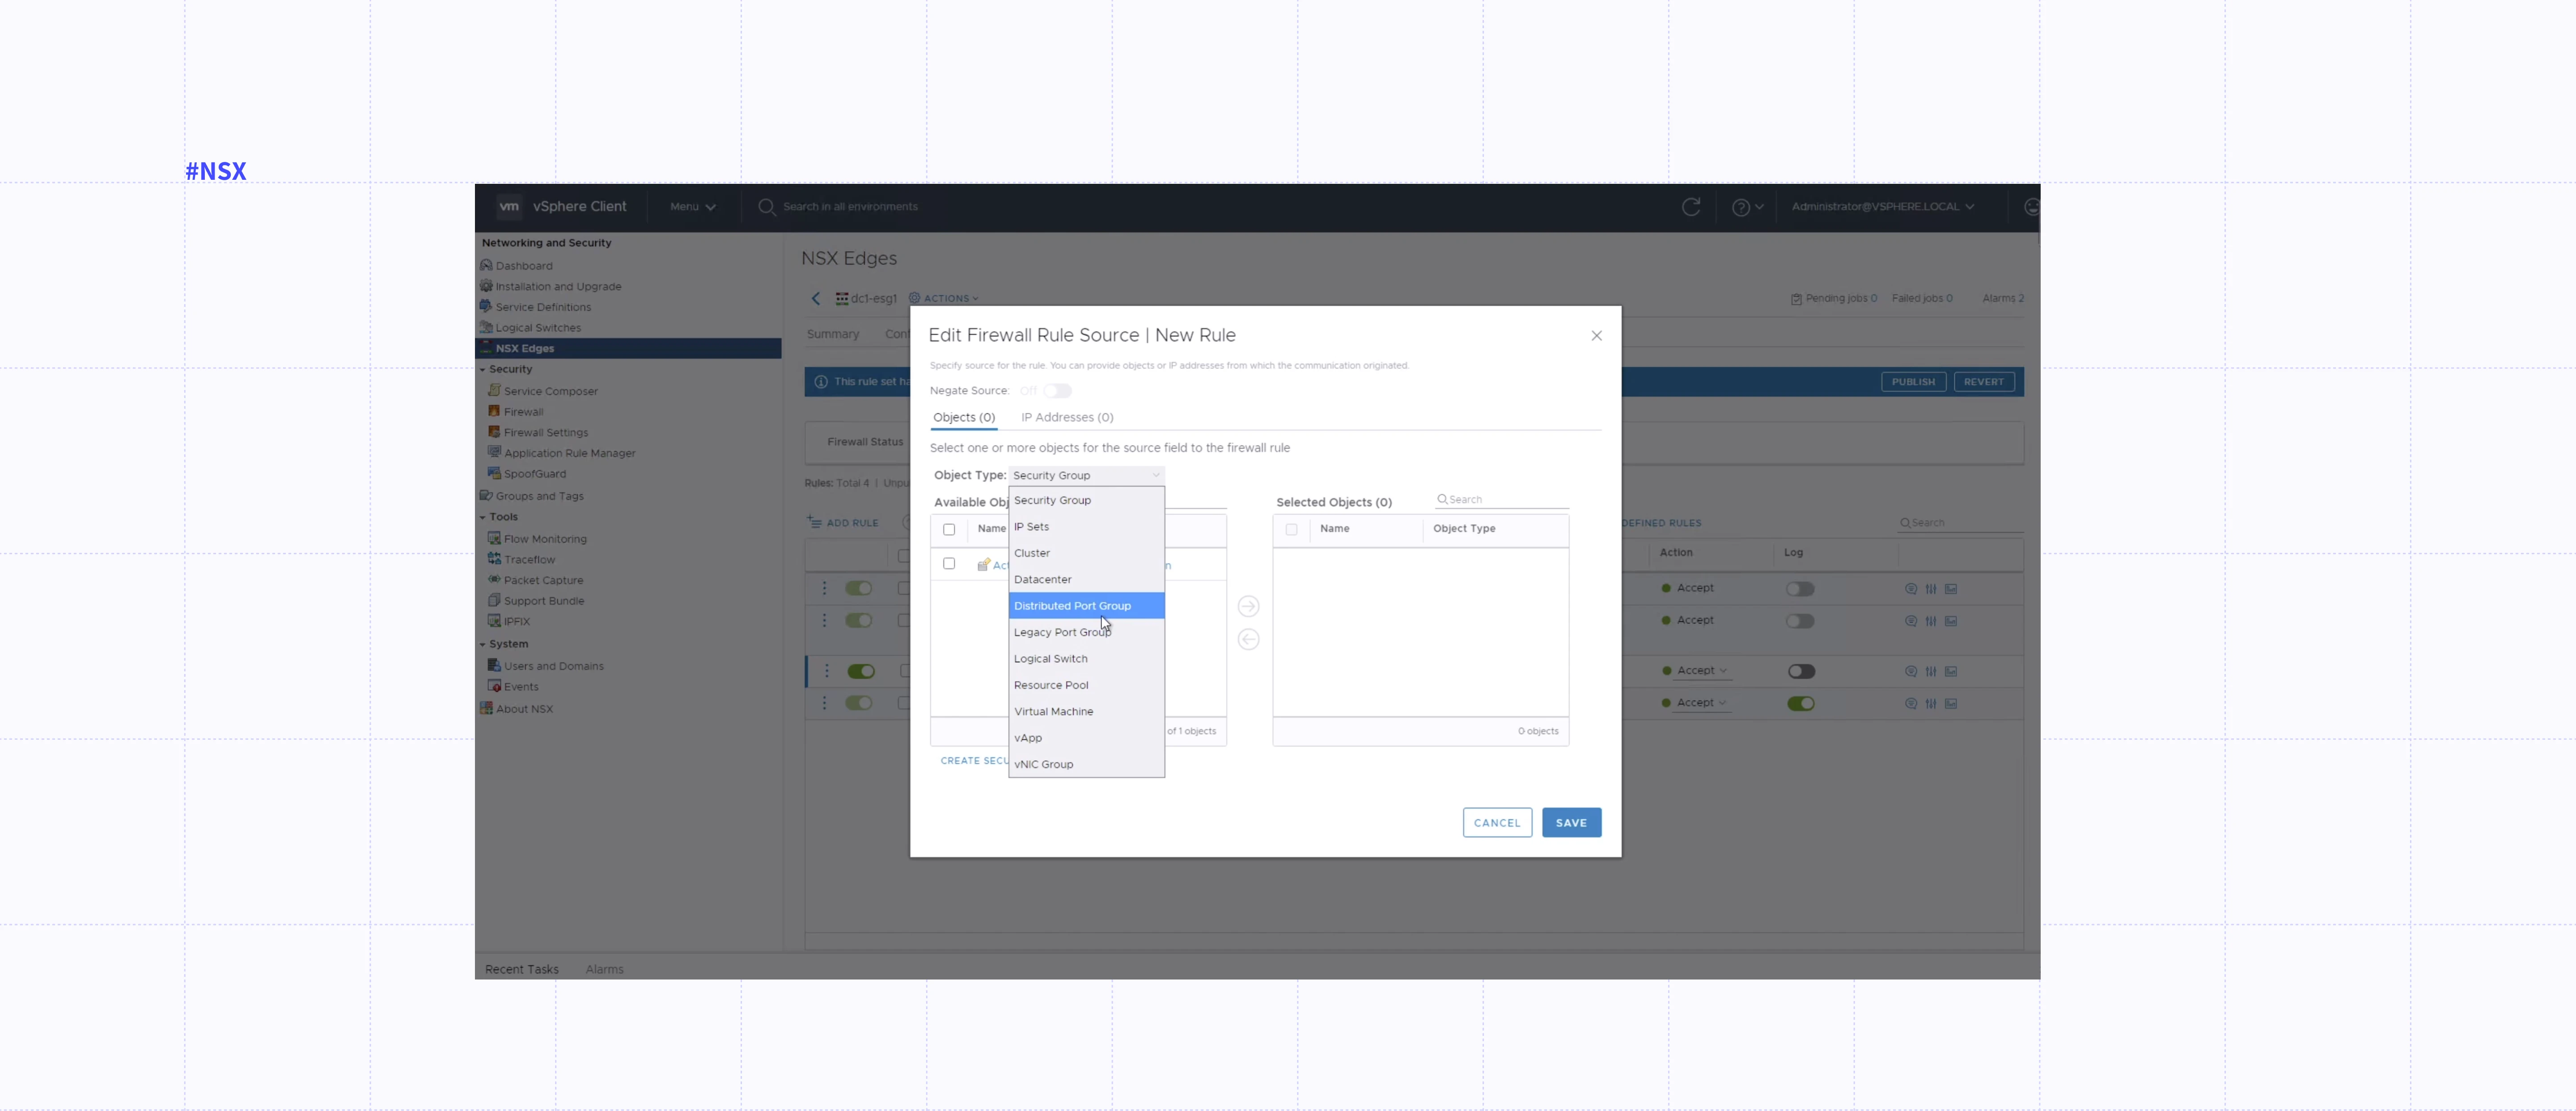
Microsegmentation networking: Nutanix Flow vs. VMware NSX HCI
Reduced complexity
Nutanix Flow is fully integrated into the Nutanix private cloud solution.
Improved efficiency
Nutanix Flow reduce the manual effort and human errors involved in network security operations.
Enhanced compliance
Nutanix Flow gives visibility into the security posture of your applications and data
Extended functionality
Nutanix Flow allows to integrate with third-party network functions and tools to expand the functionality of Nutanix Flow.
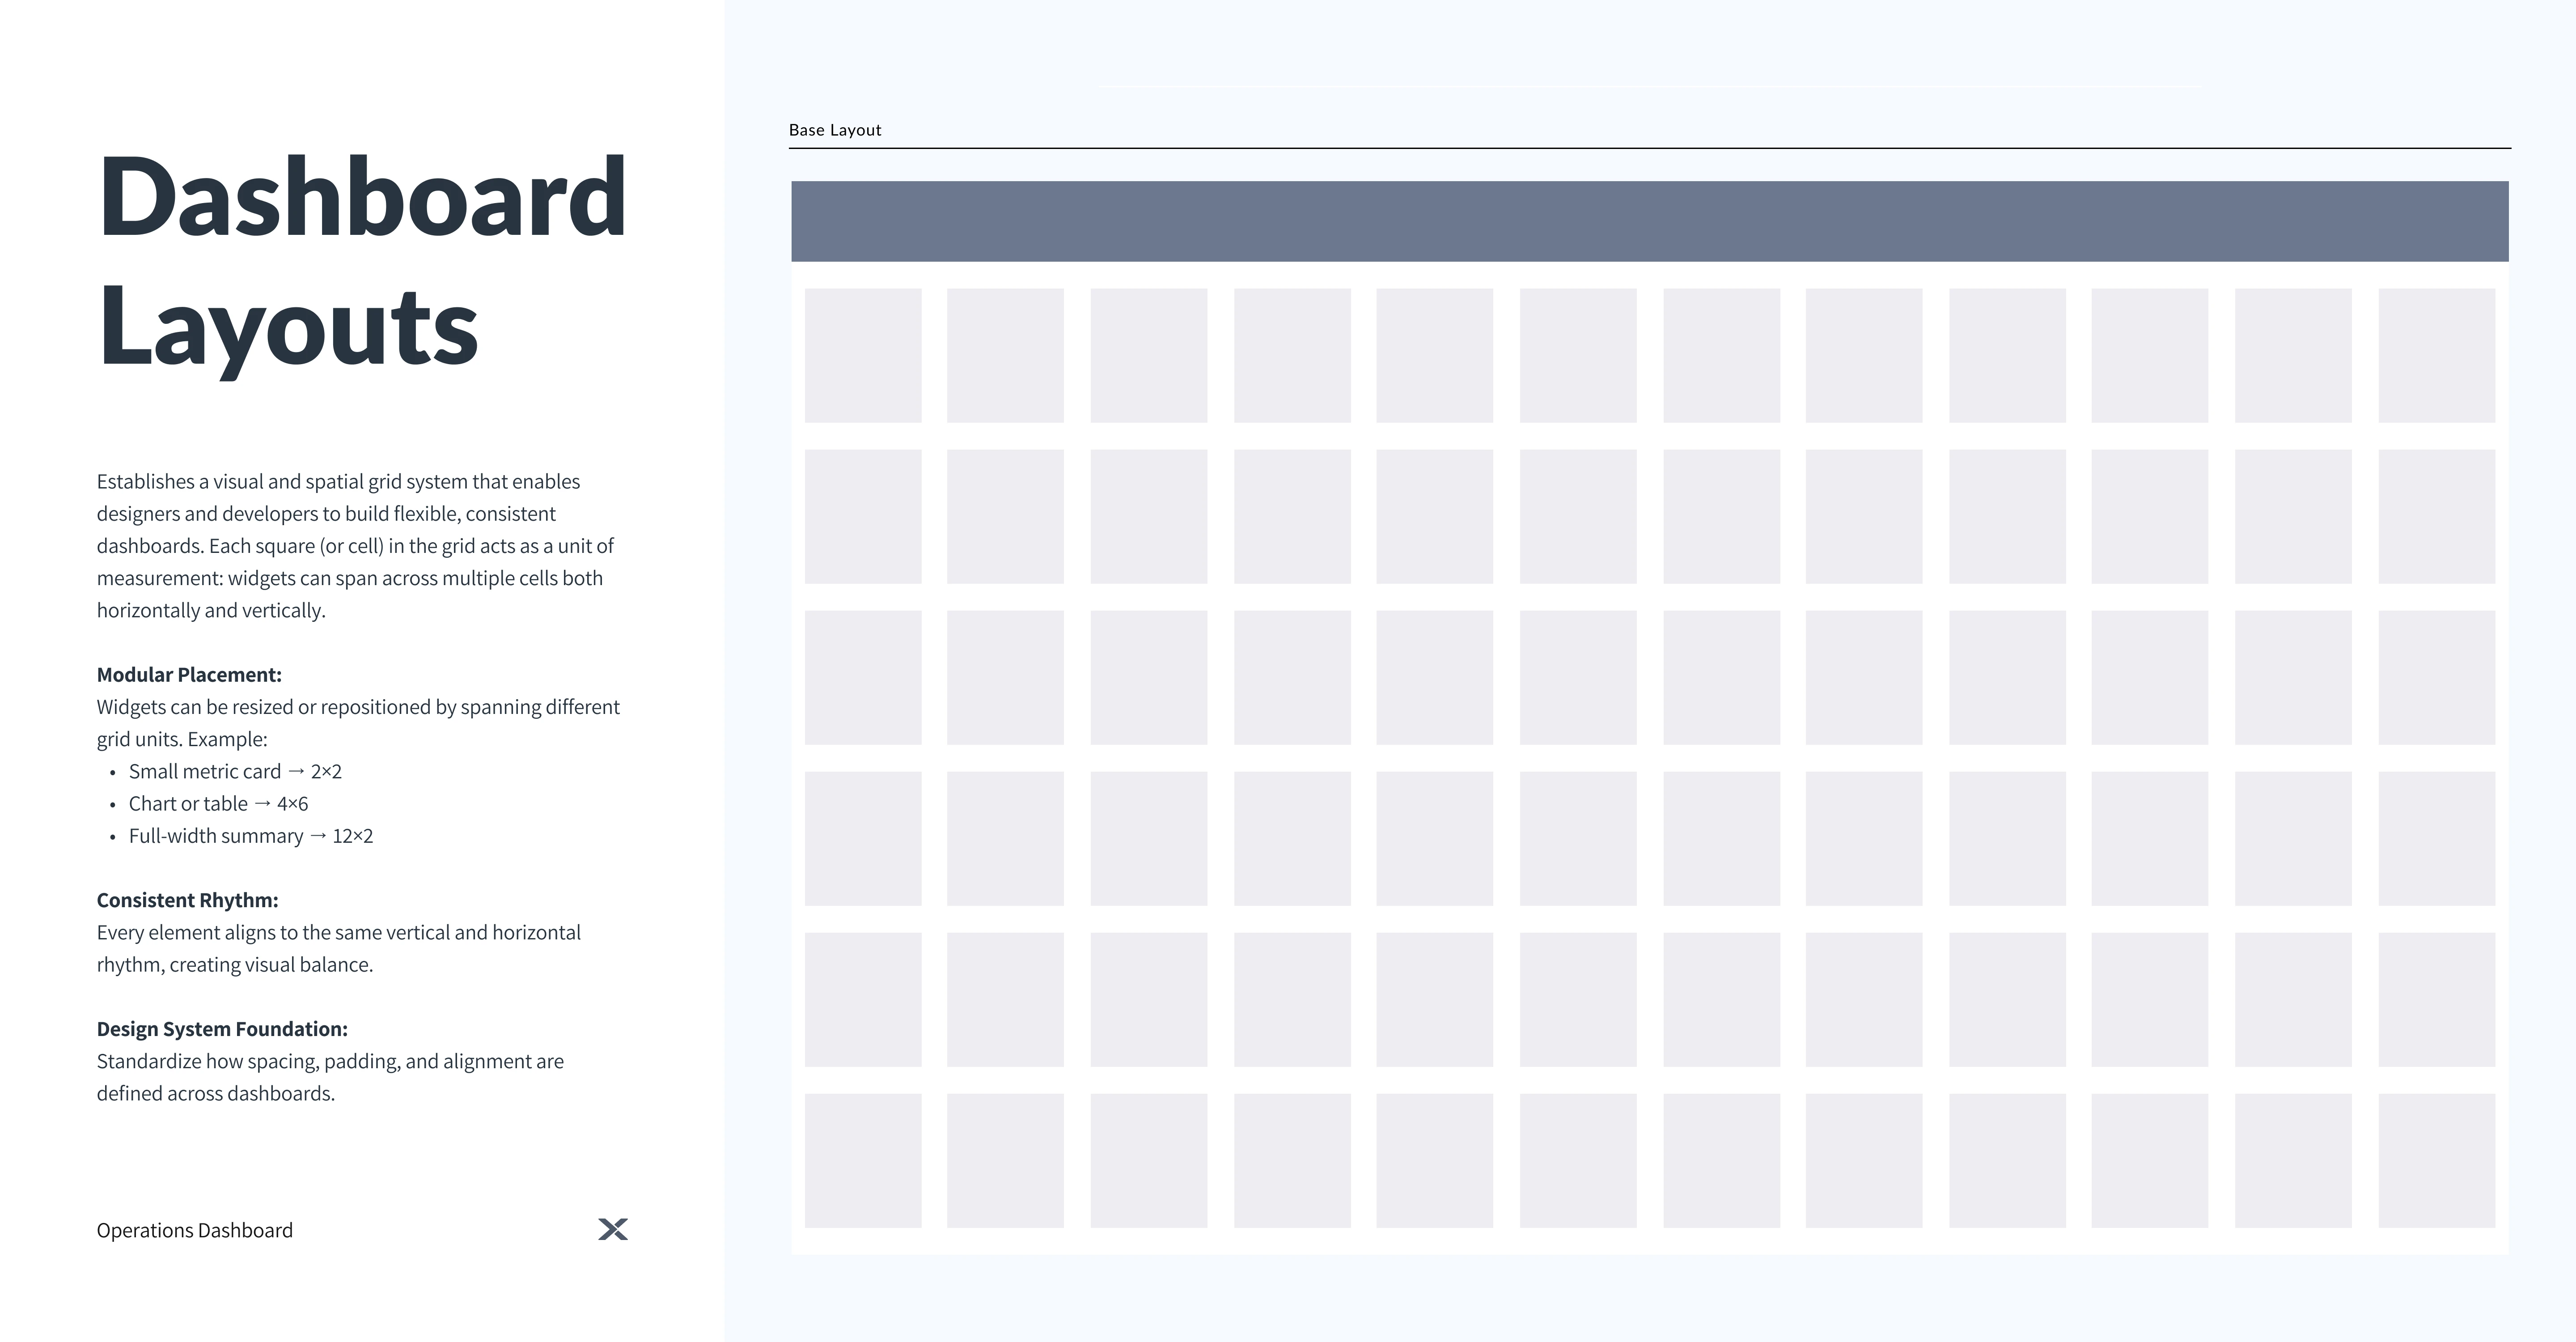
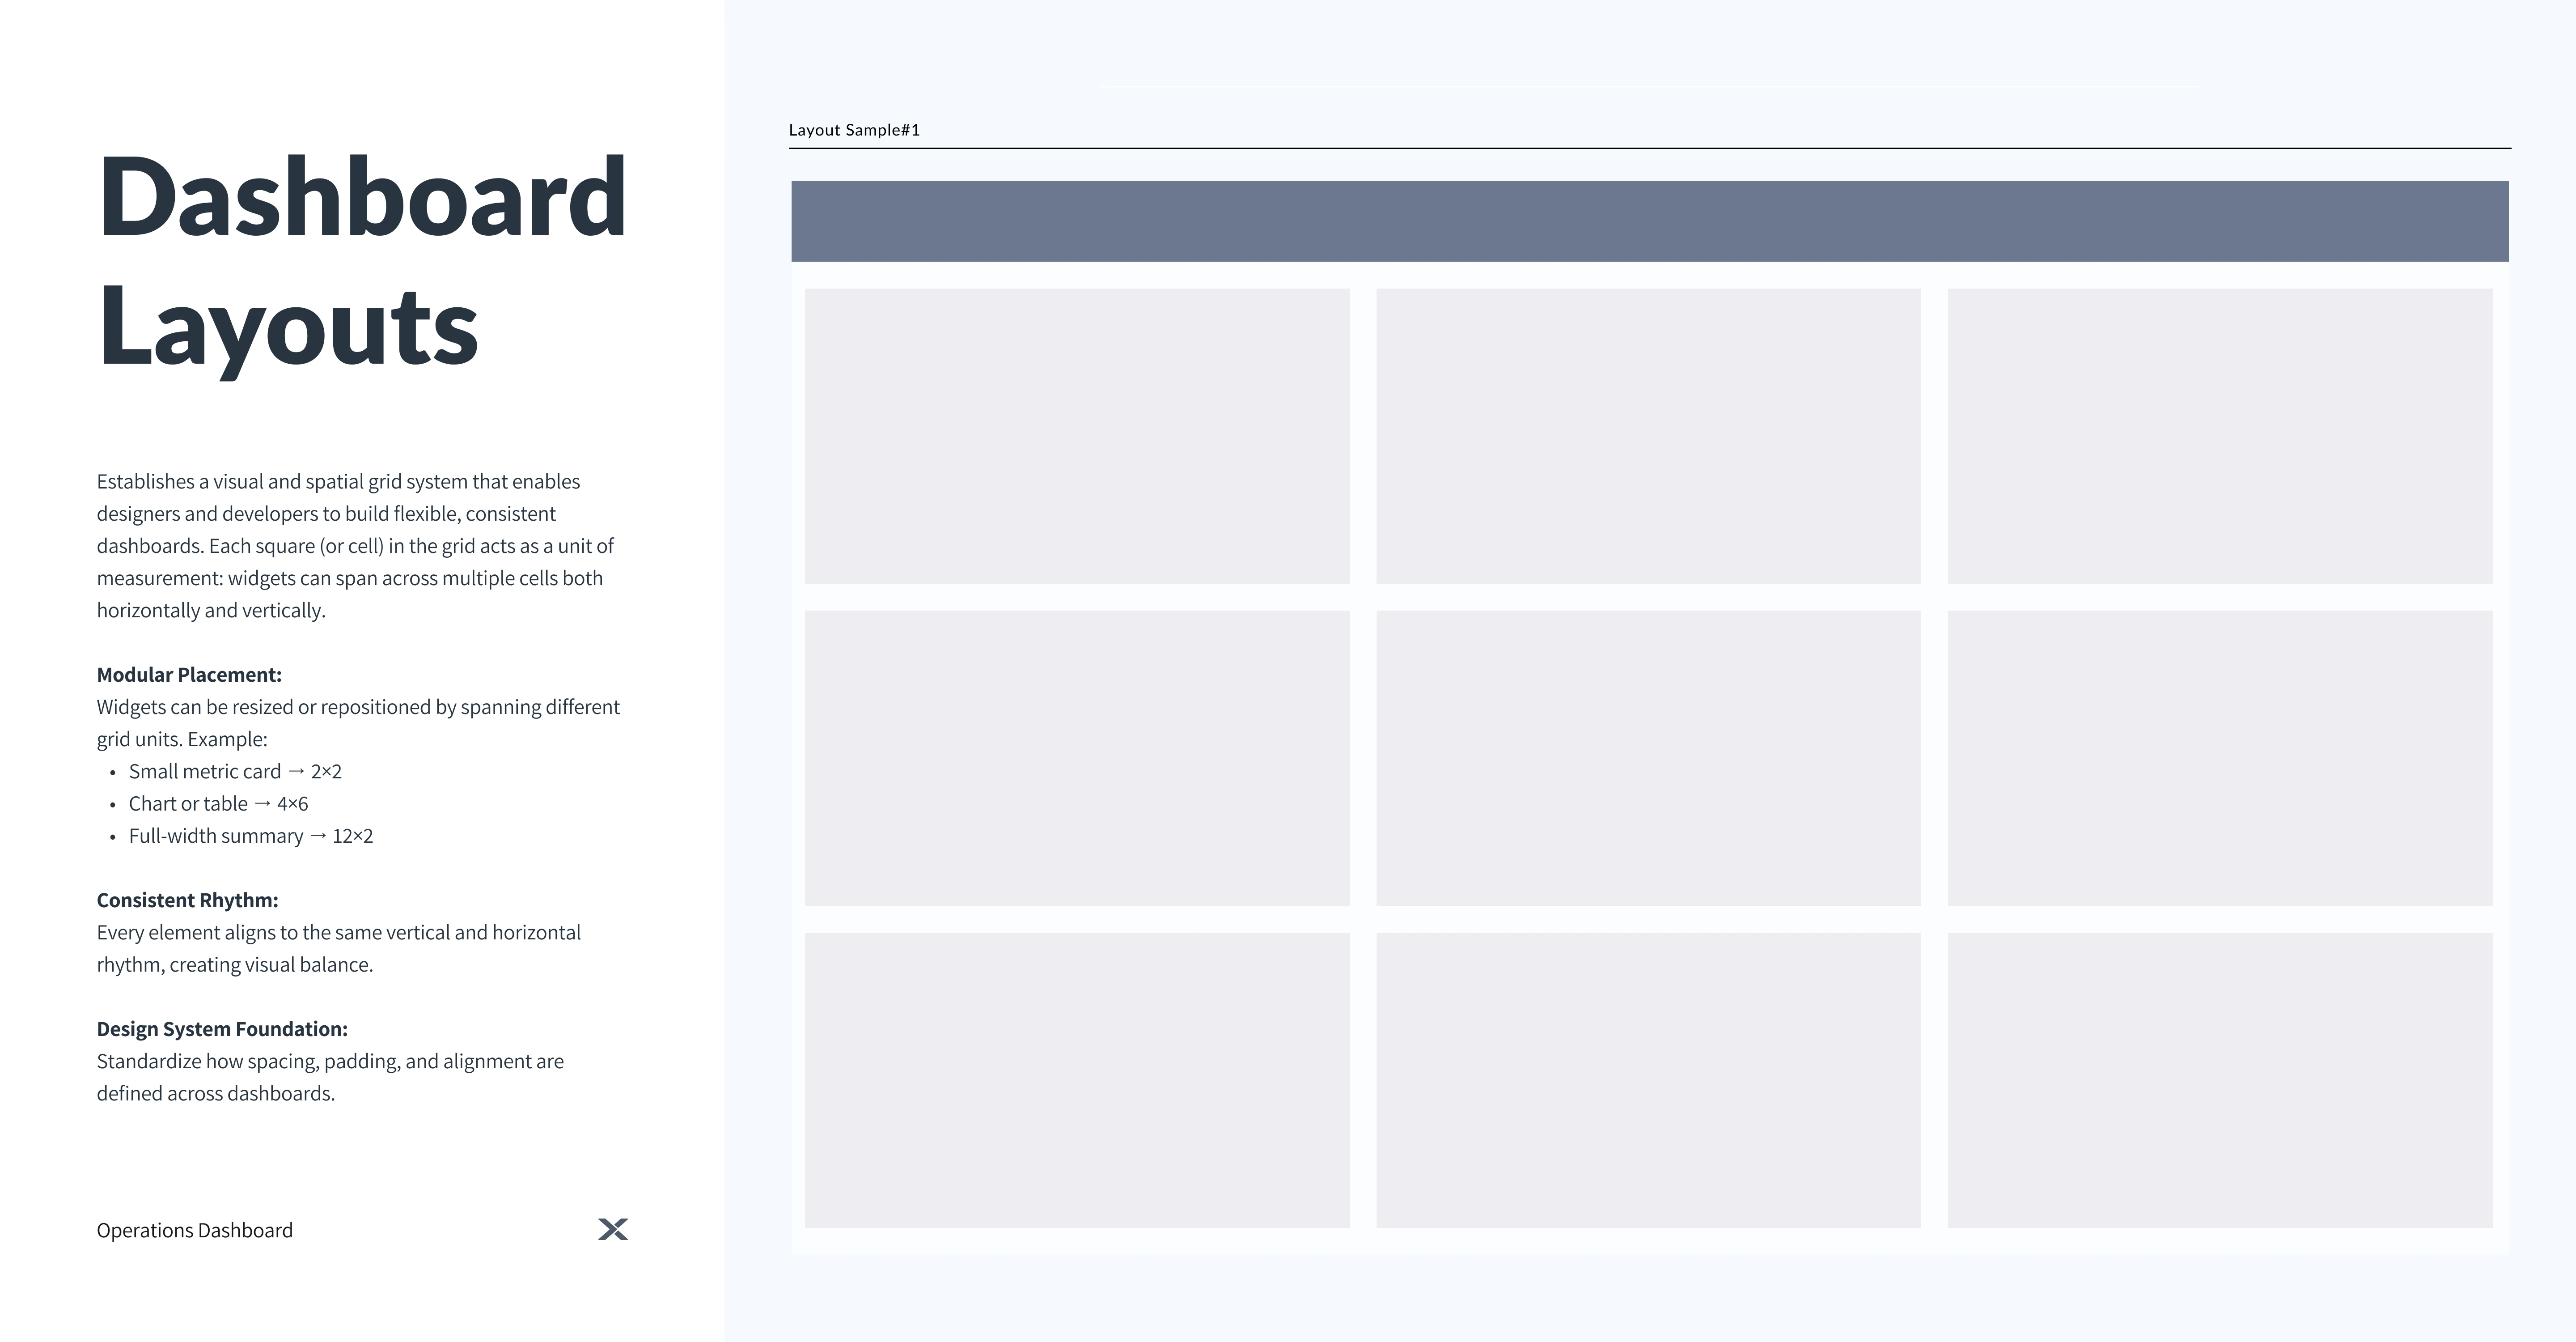
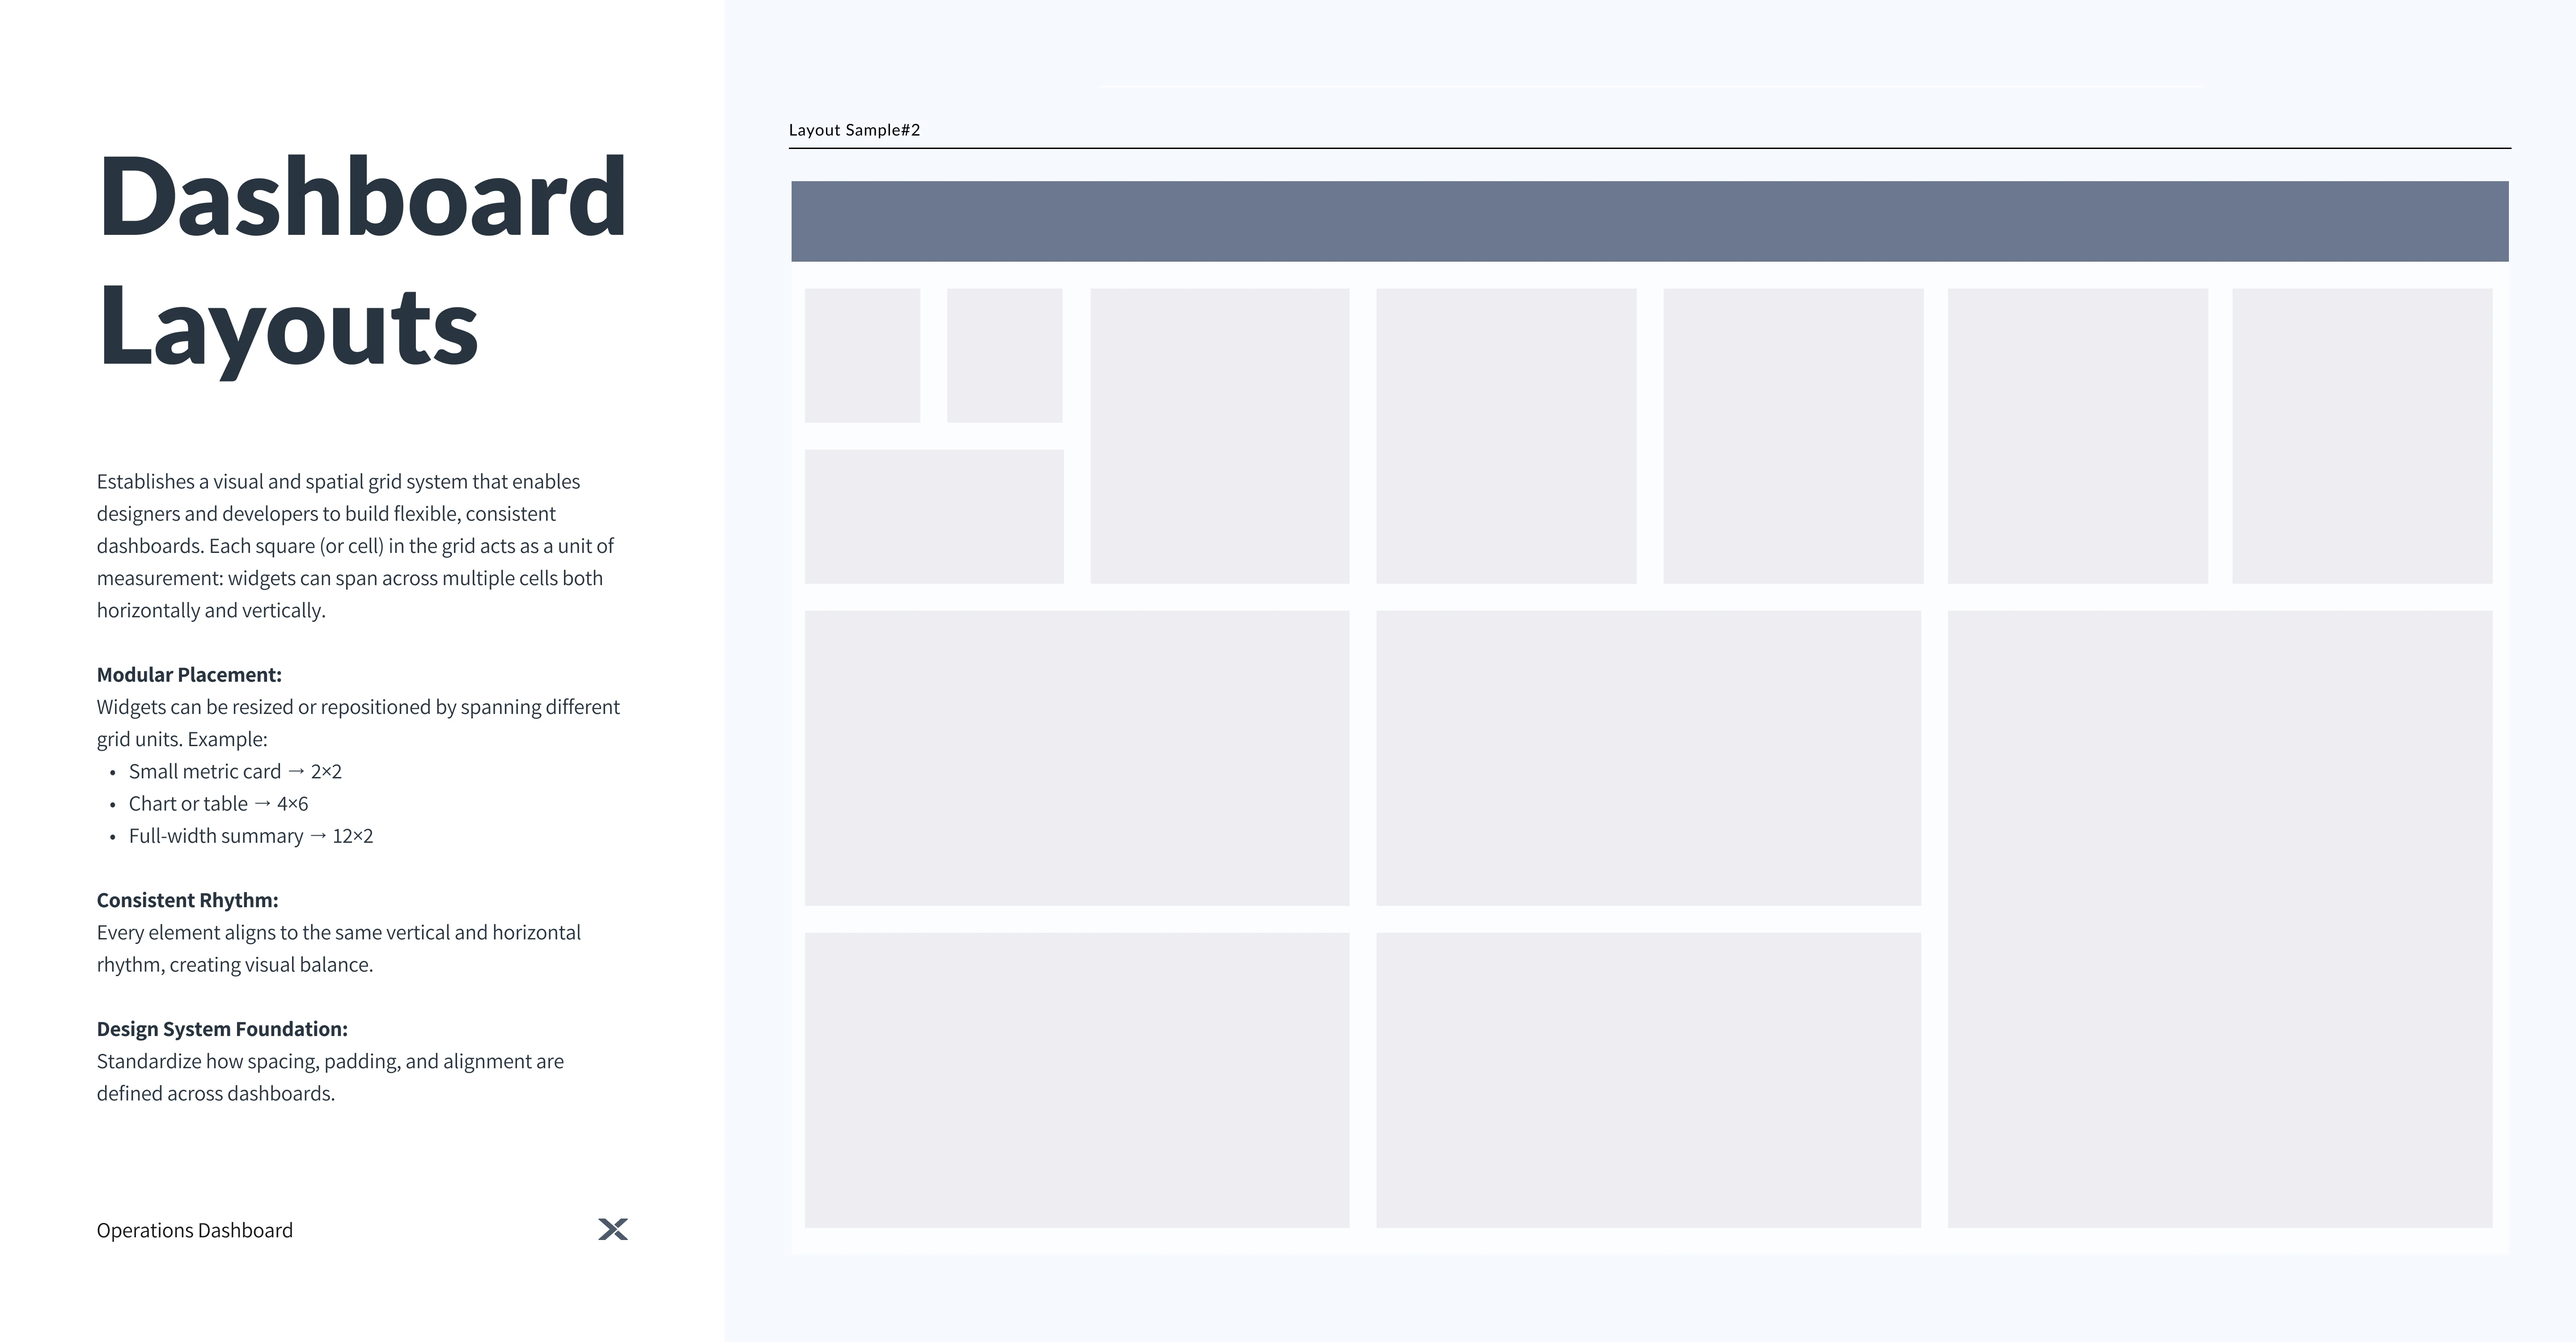
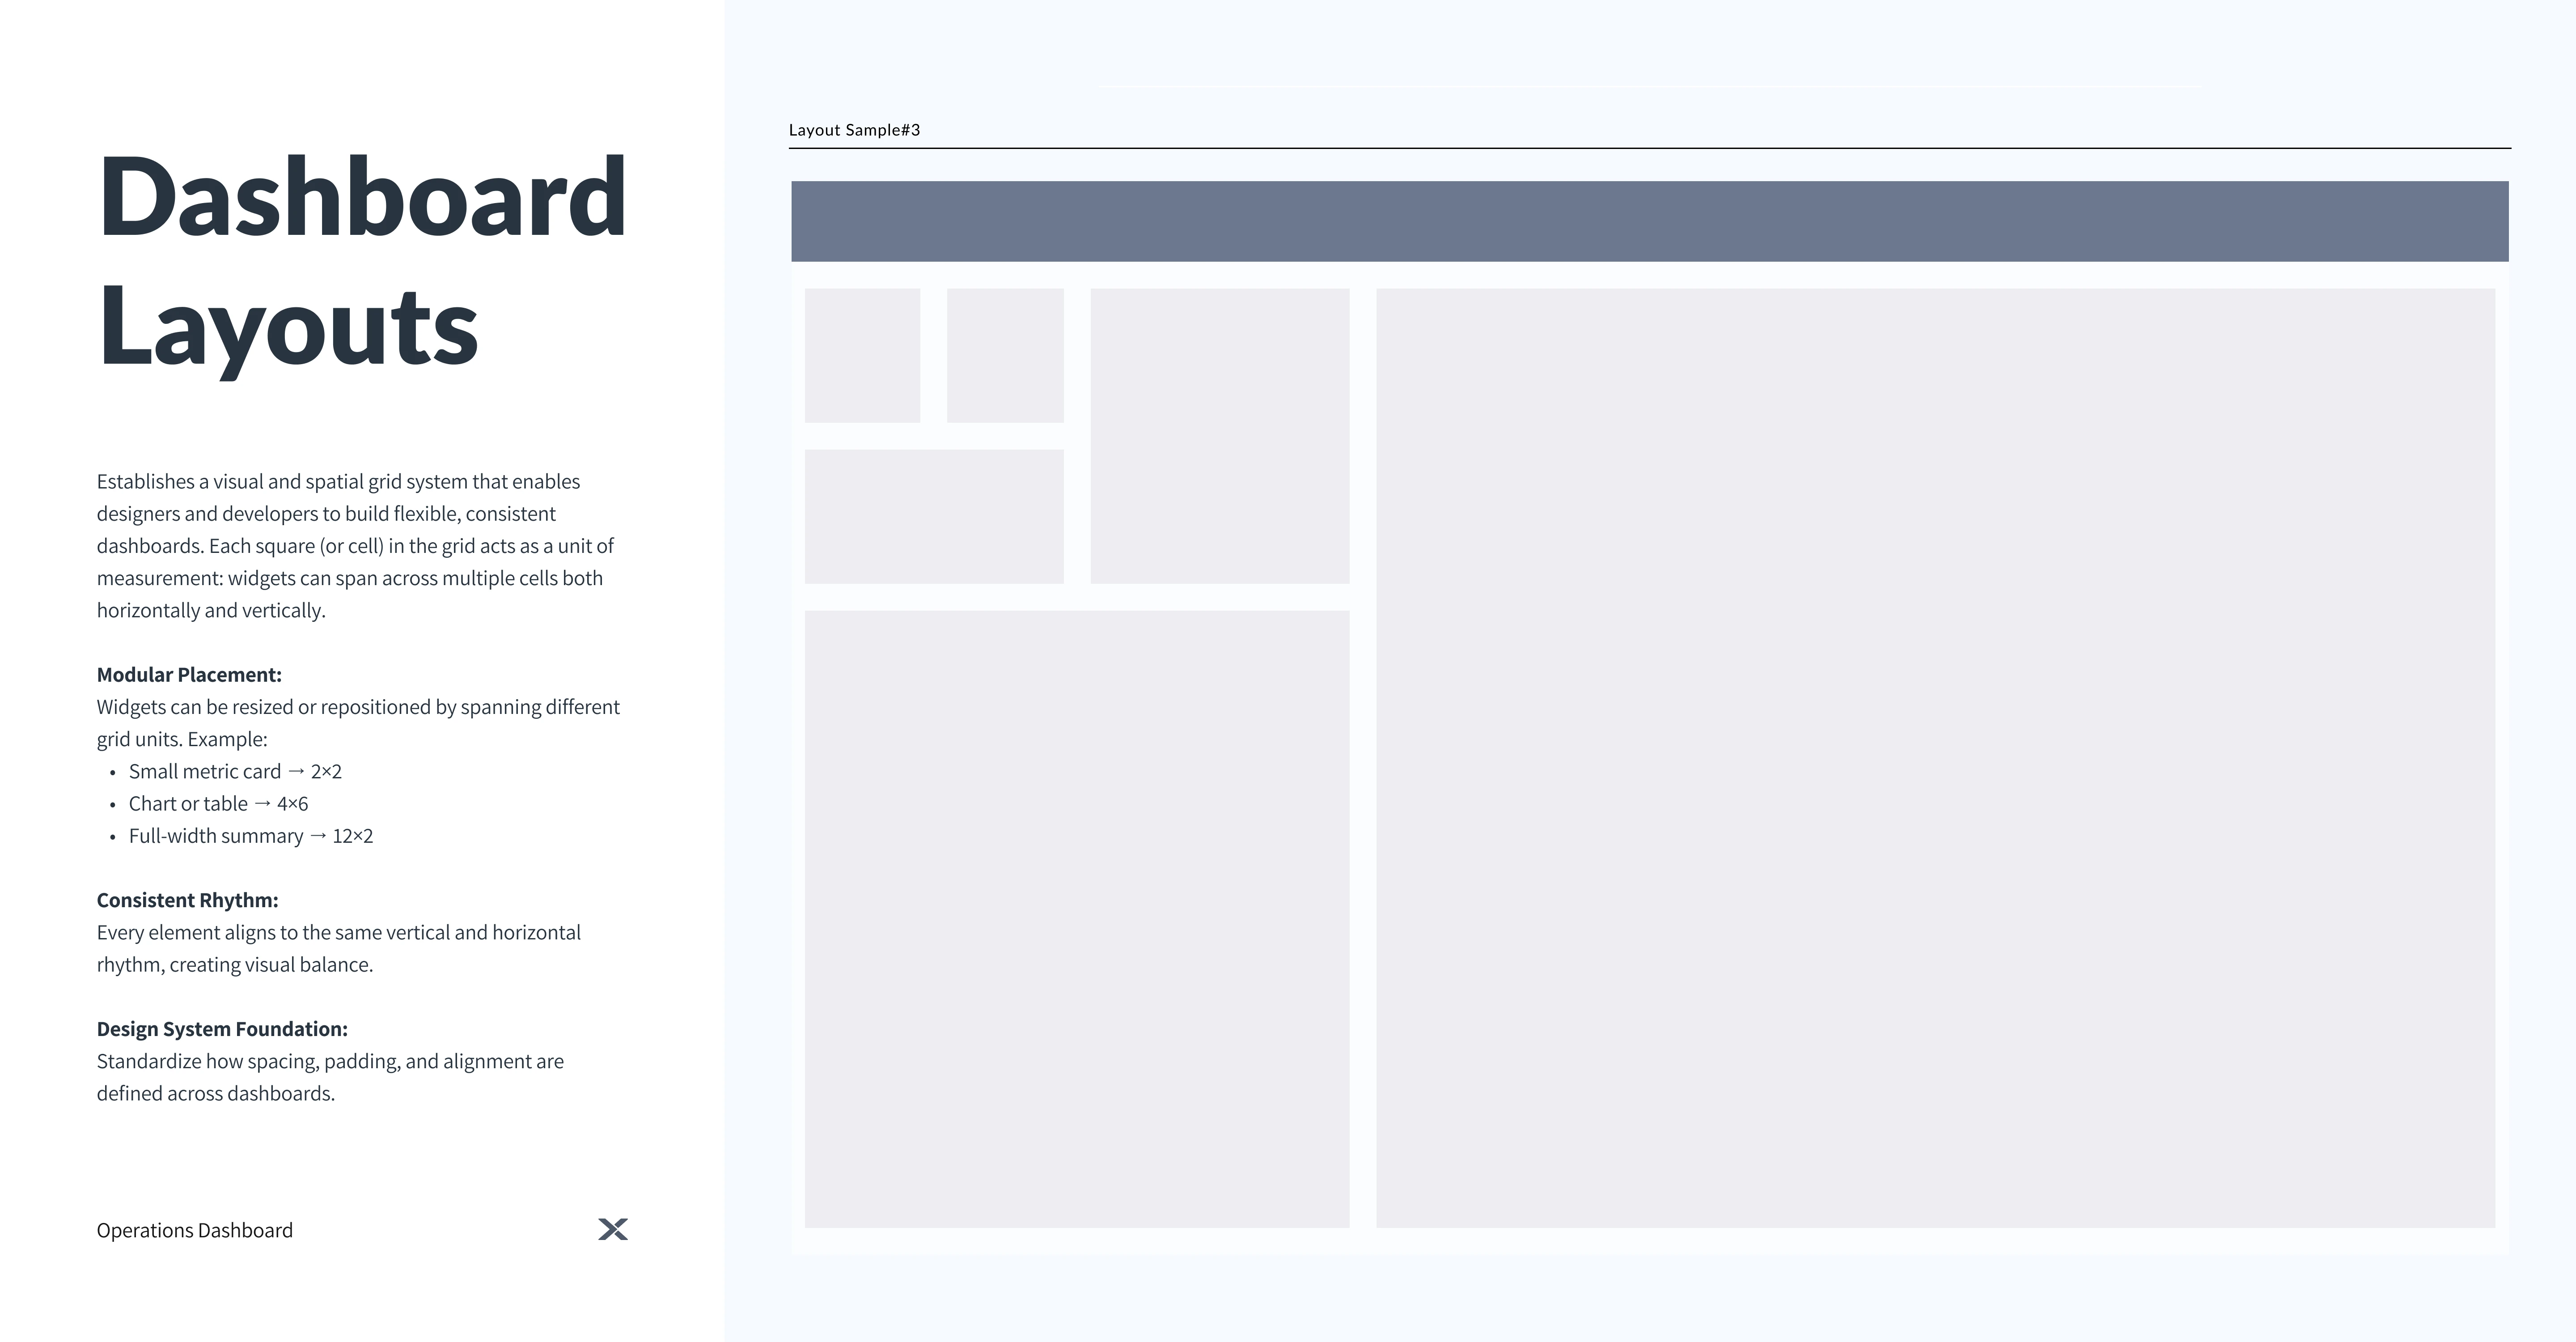
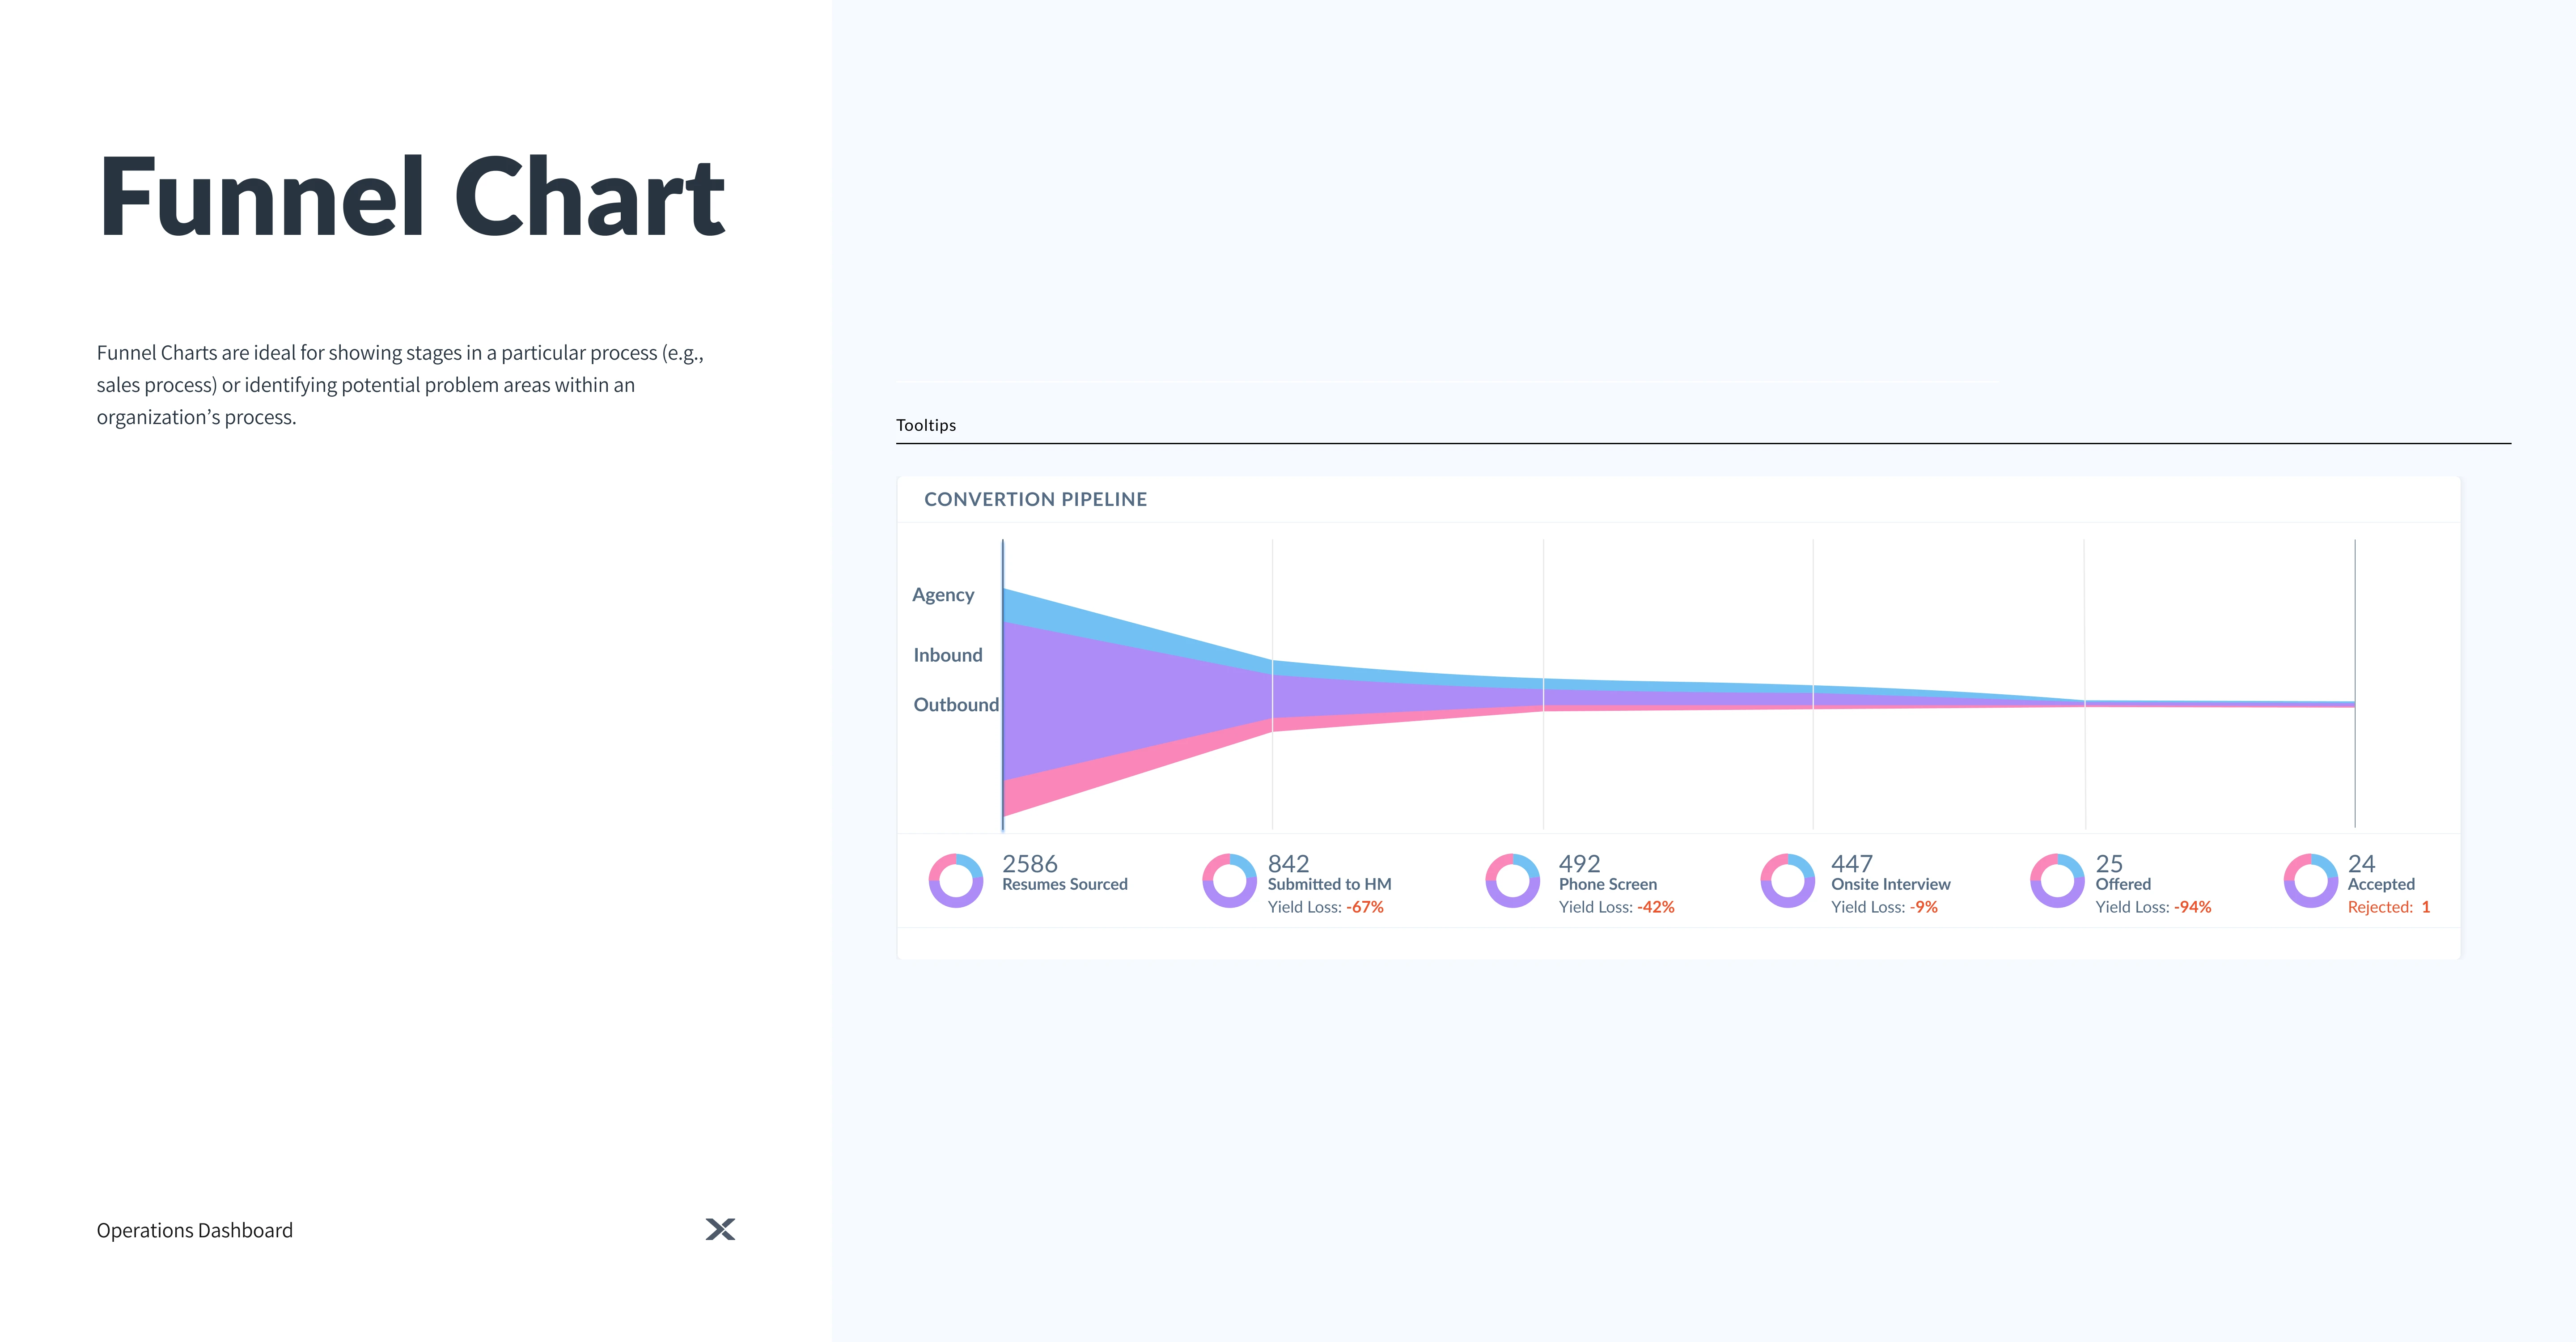
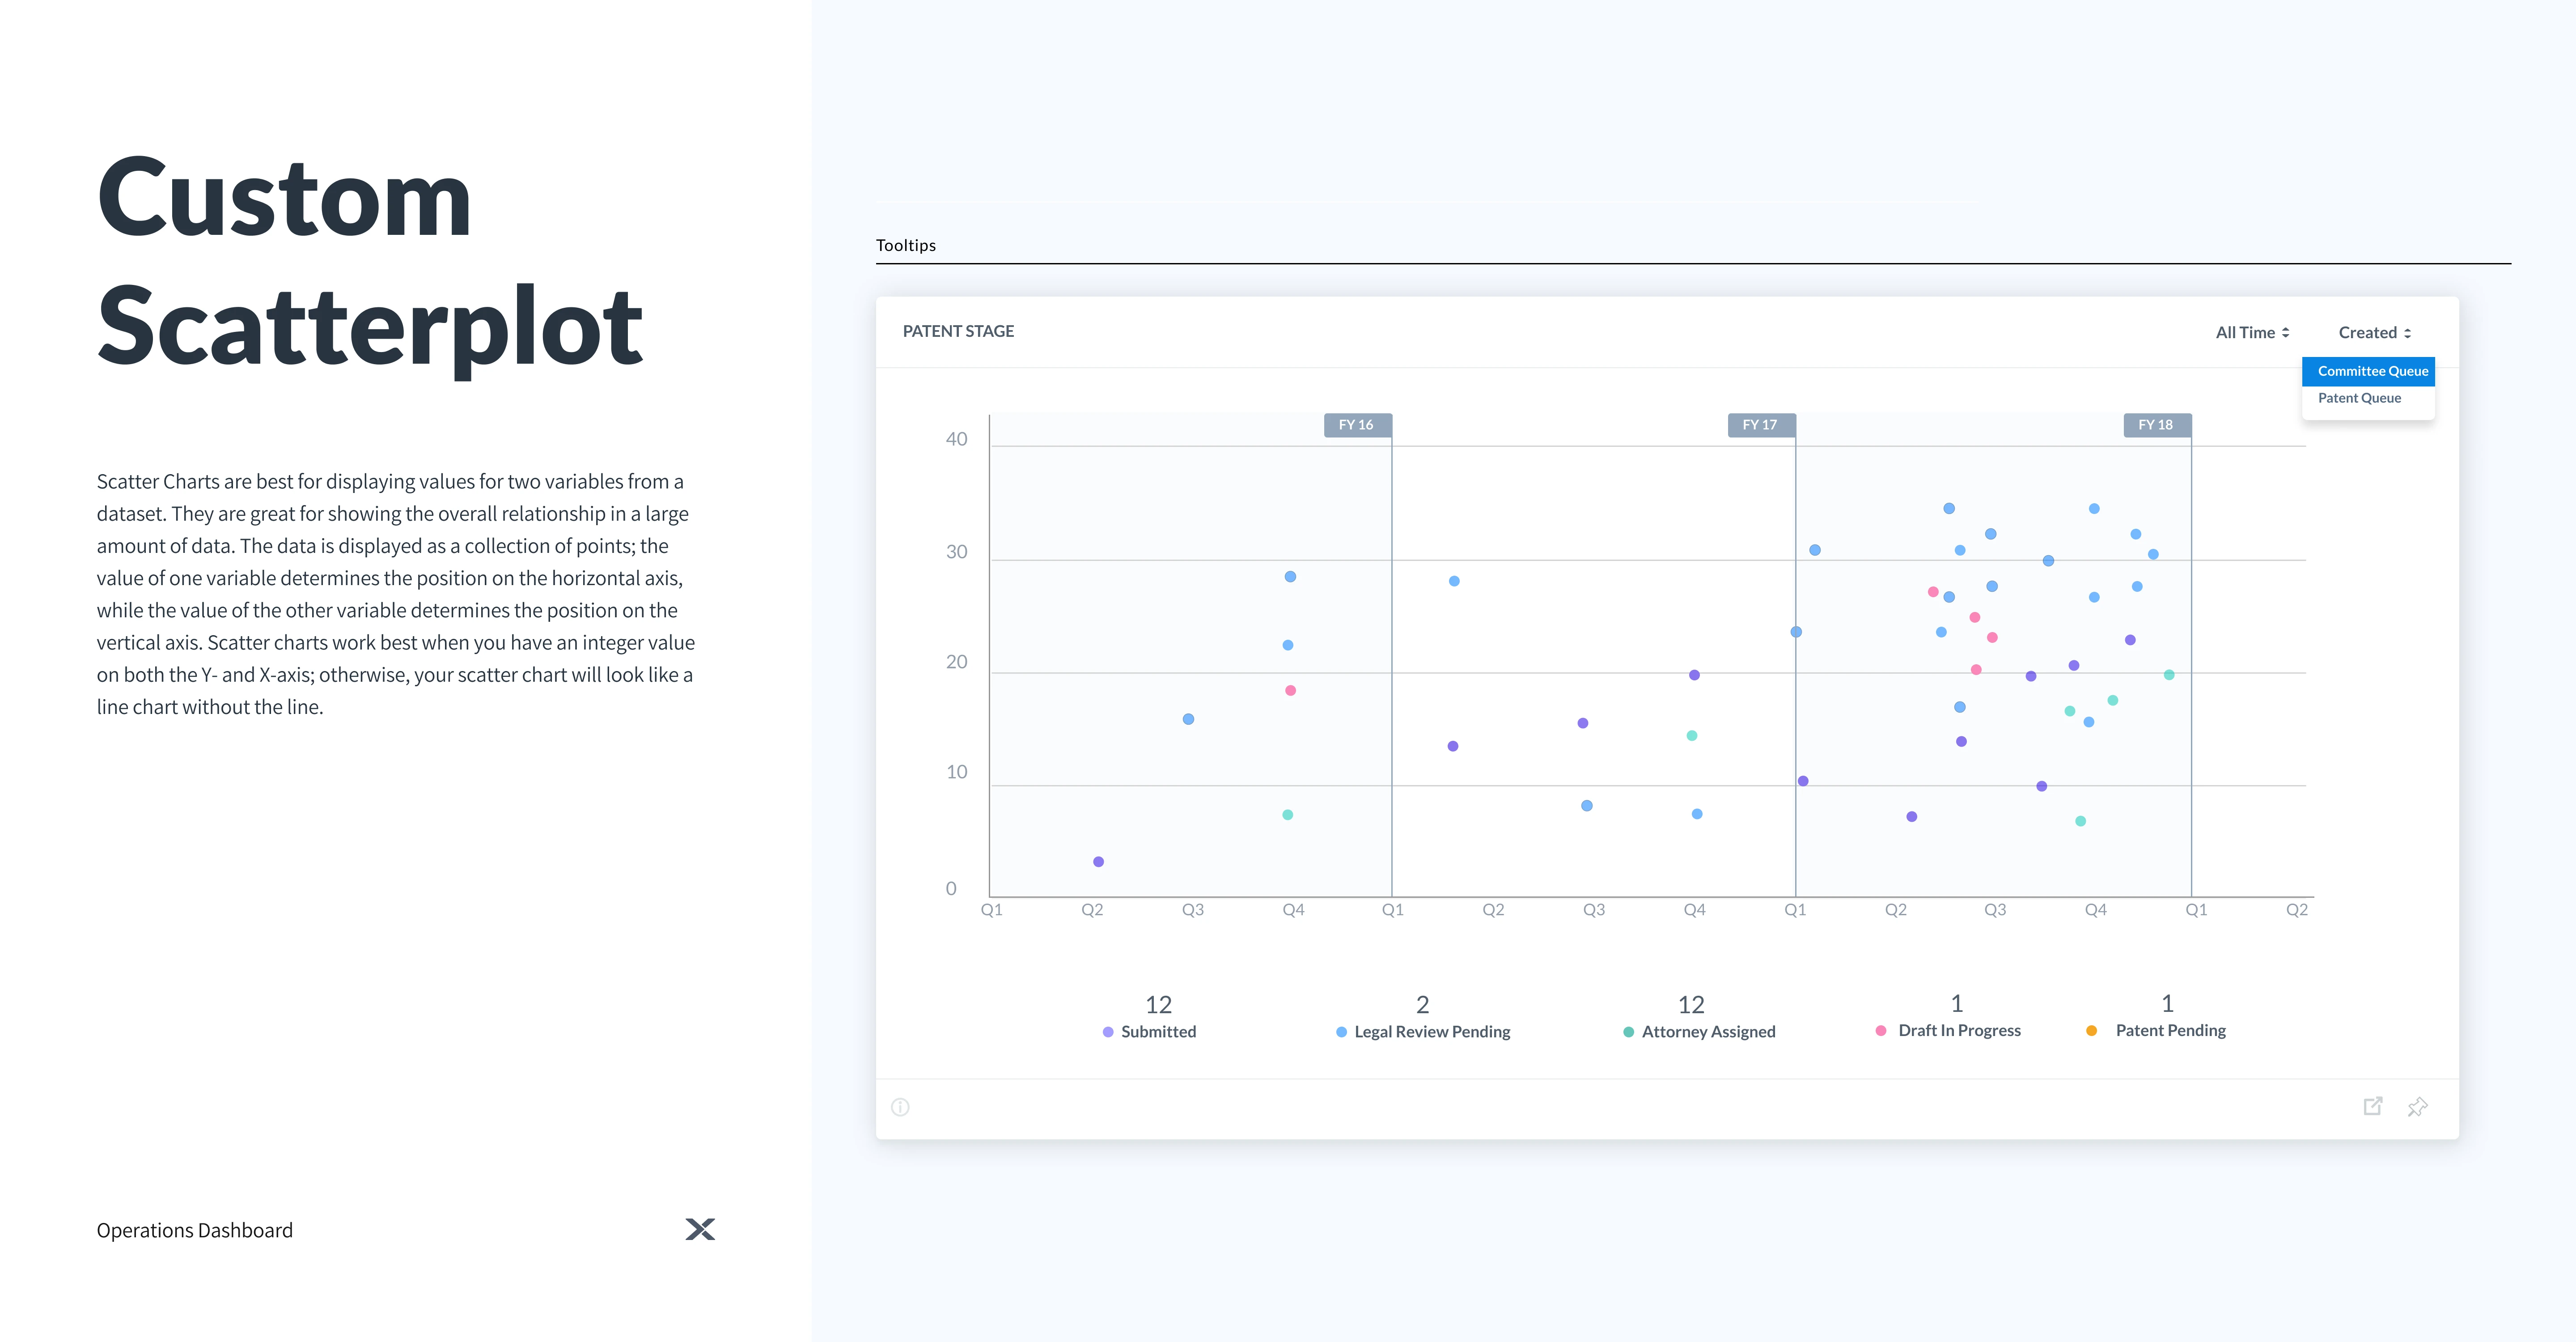
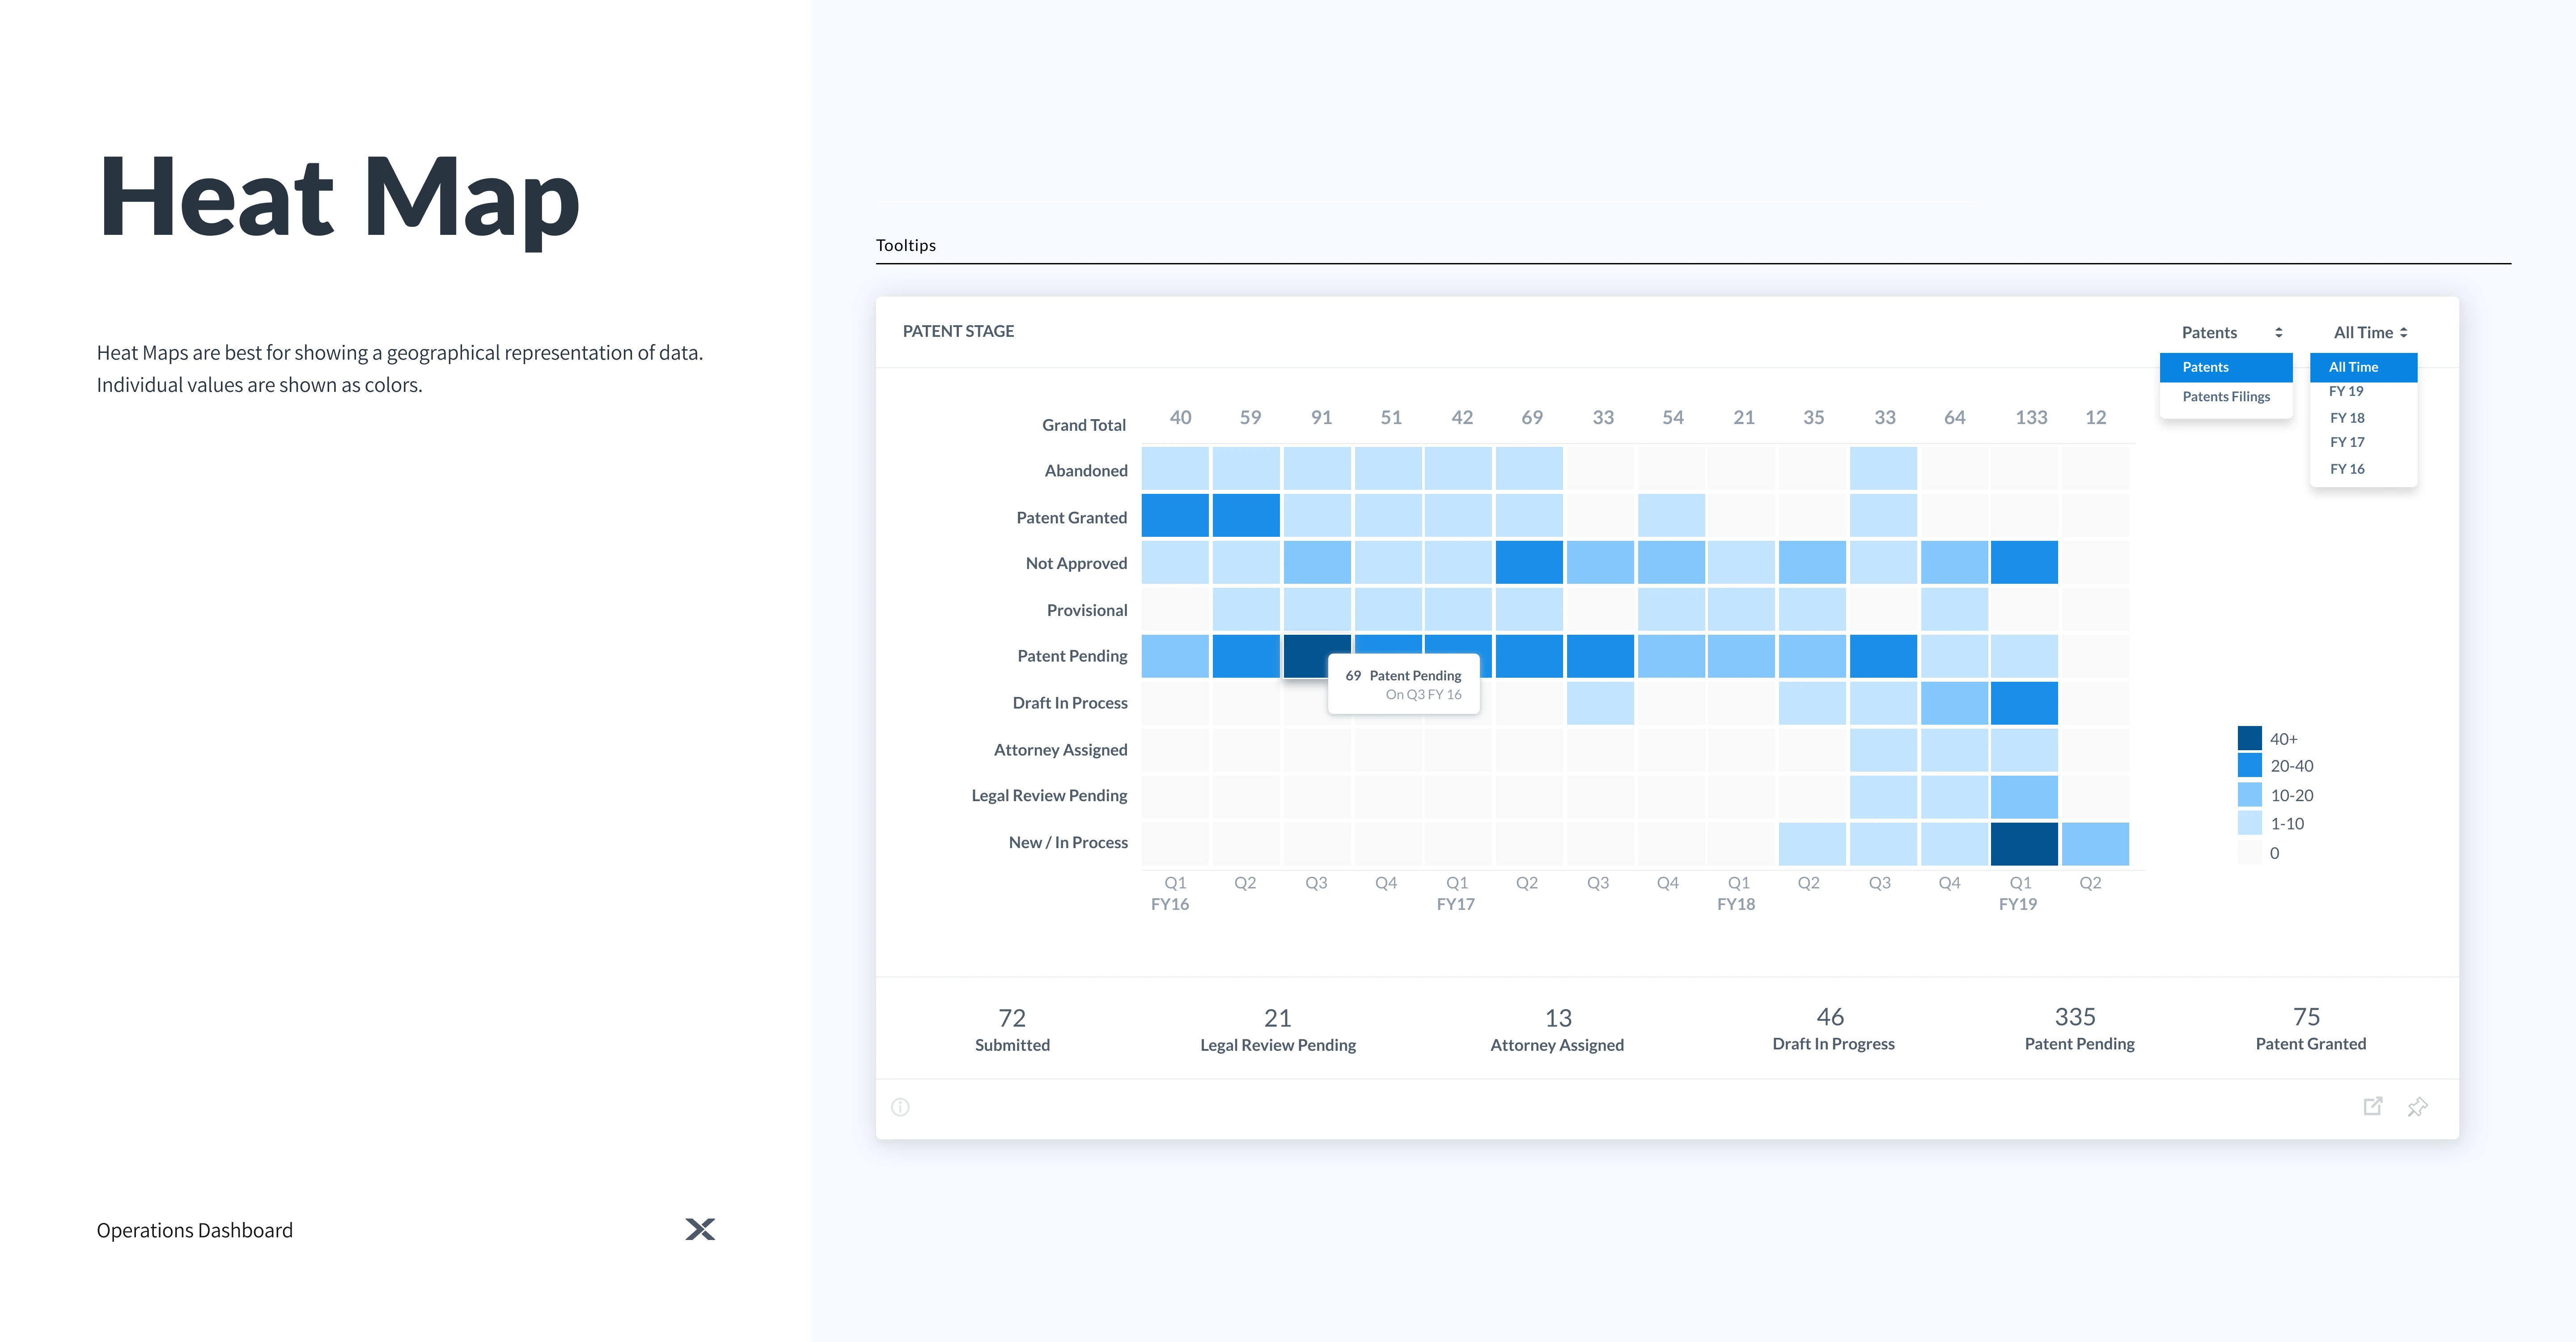
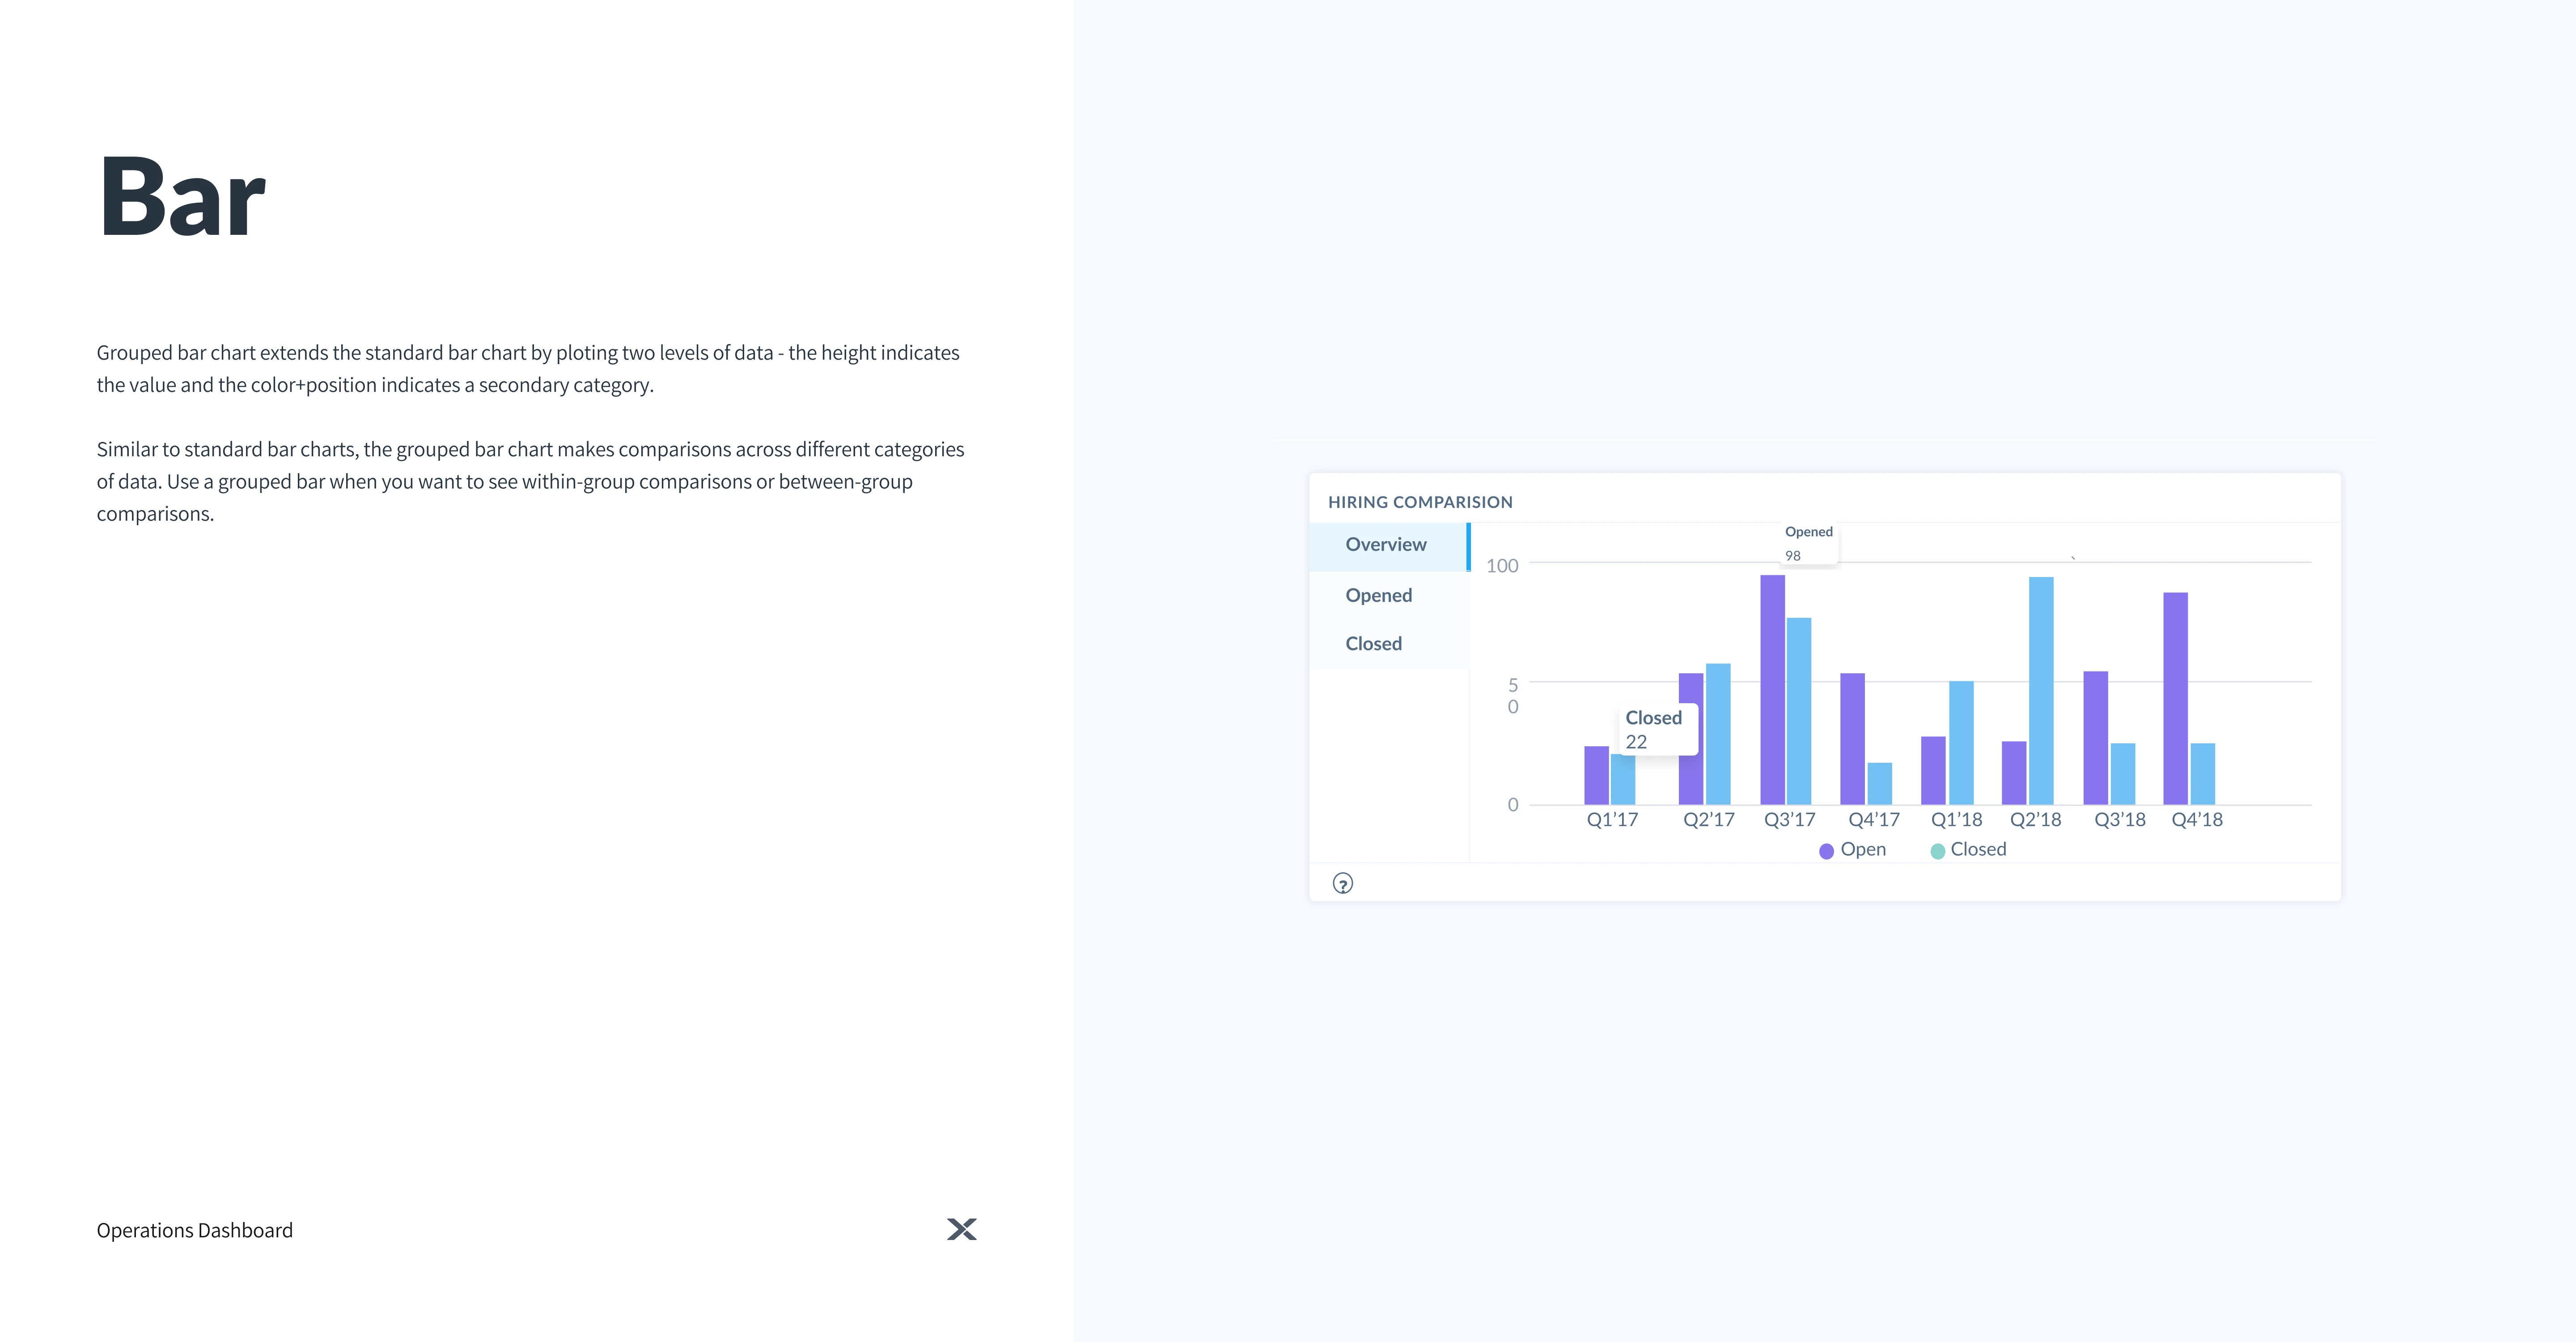
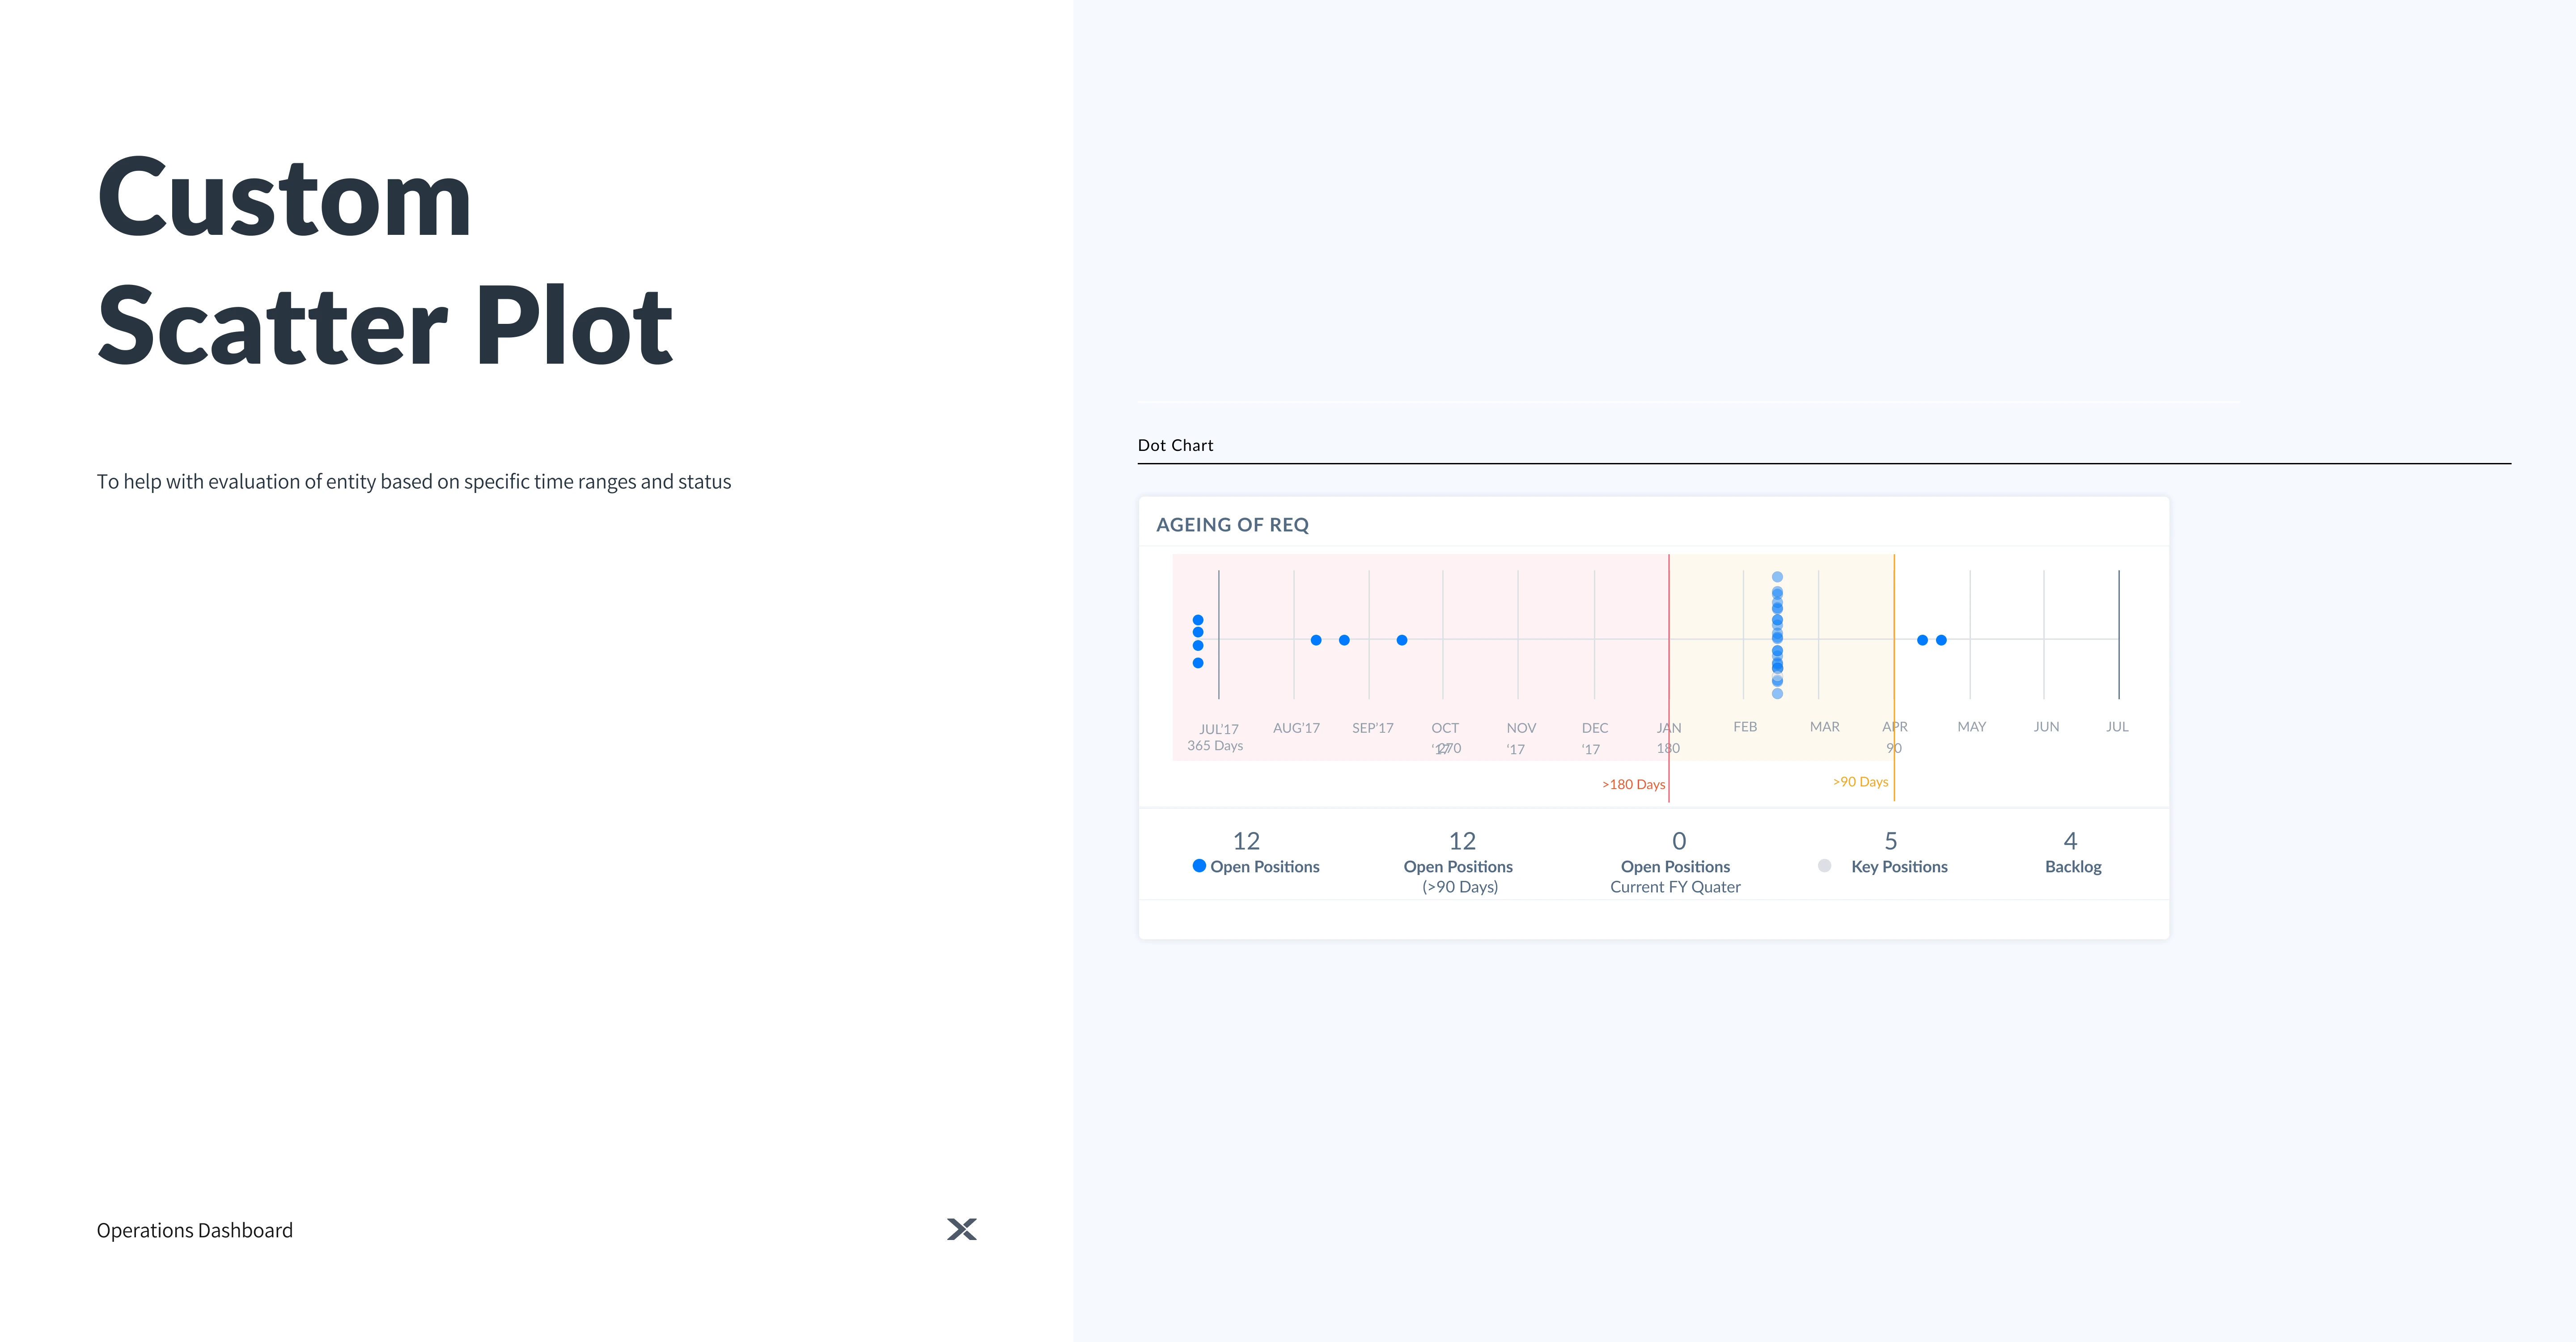
India Operations dashboard intends to support in depth briefing to stakeholders ranging from executives to managers. Its is a web interface and can be extended to mobile. It support varied operations and analysis on Key Performance Indicators such as recruitment, innovation, human resource, events and college relations.
04 Project Overview: Nutanix Operations Dashboard
Operations dashboard to assist strategic decision making for higher management of Nutanix.
Key Considerations
Exisiting Libraries, Dashboard for reporting, analysis, insights gathering for strategic decision making.
Target Users
Chief Officer (CEO, COO, CTO) Senior Directors and Managers
Role
Lead Designer and Mentor
Contribution
Lead, UX Flows, Data Visualization
Project Duration:
8-12 months
Team
Team of 2 design interns
Project Status
In Production
Recruitment
Patents
People
Events
Projects
College Hires
How is the innovation and delivery over the period of time
How many new recruits did we hire (this year and across years while showing trend line
chart)
How
many interns declined our offer and did not join the internship.
Of the joined interns what
was
the conversion percentage.
Which
tenure
is
giving us a better conversion (including a college + tenure combination)
If the same college
has
both 2 and 6 month internships - which is working better for us.
How many NCGs declined our
offer Of the declined how many were direct
hires
and how many were Intern Conversion College/College group wise
How is the break up of the
following
Number of Offers - Intern Conversion and NCG Decline rates
Trend of how we
have
hired
Across college groups
Between Direct hire and intern conversions
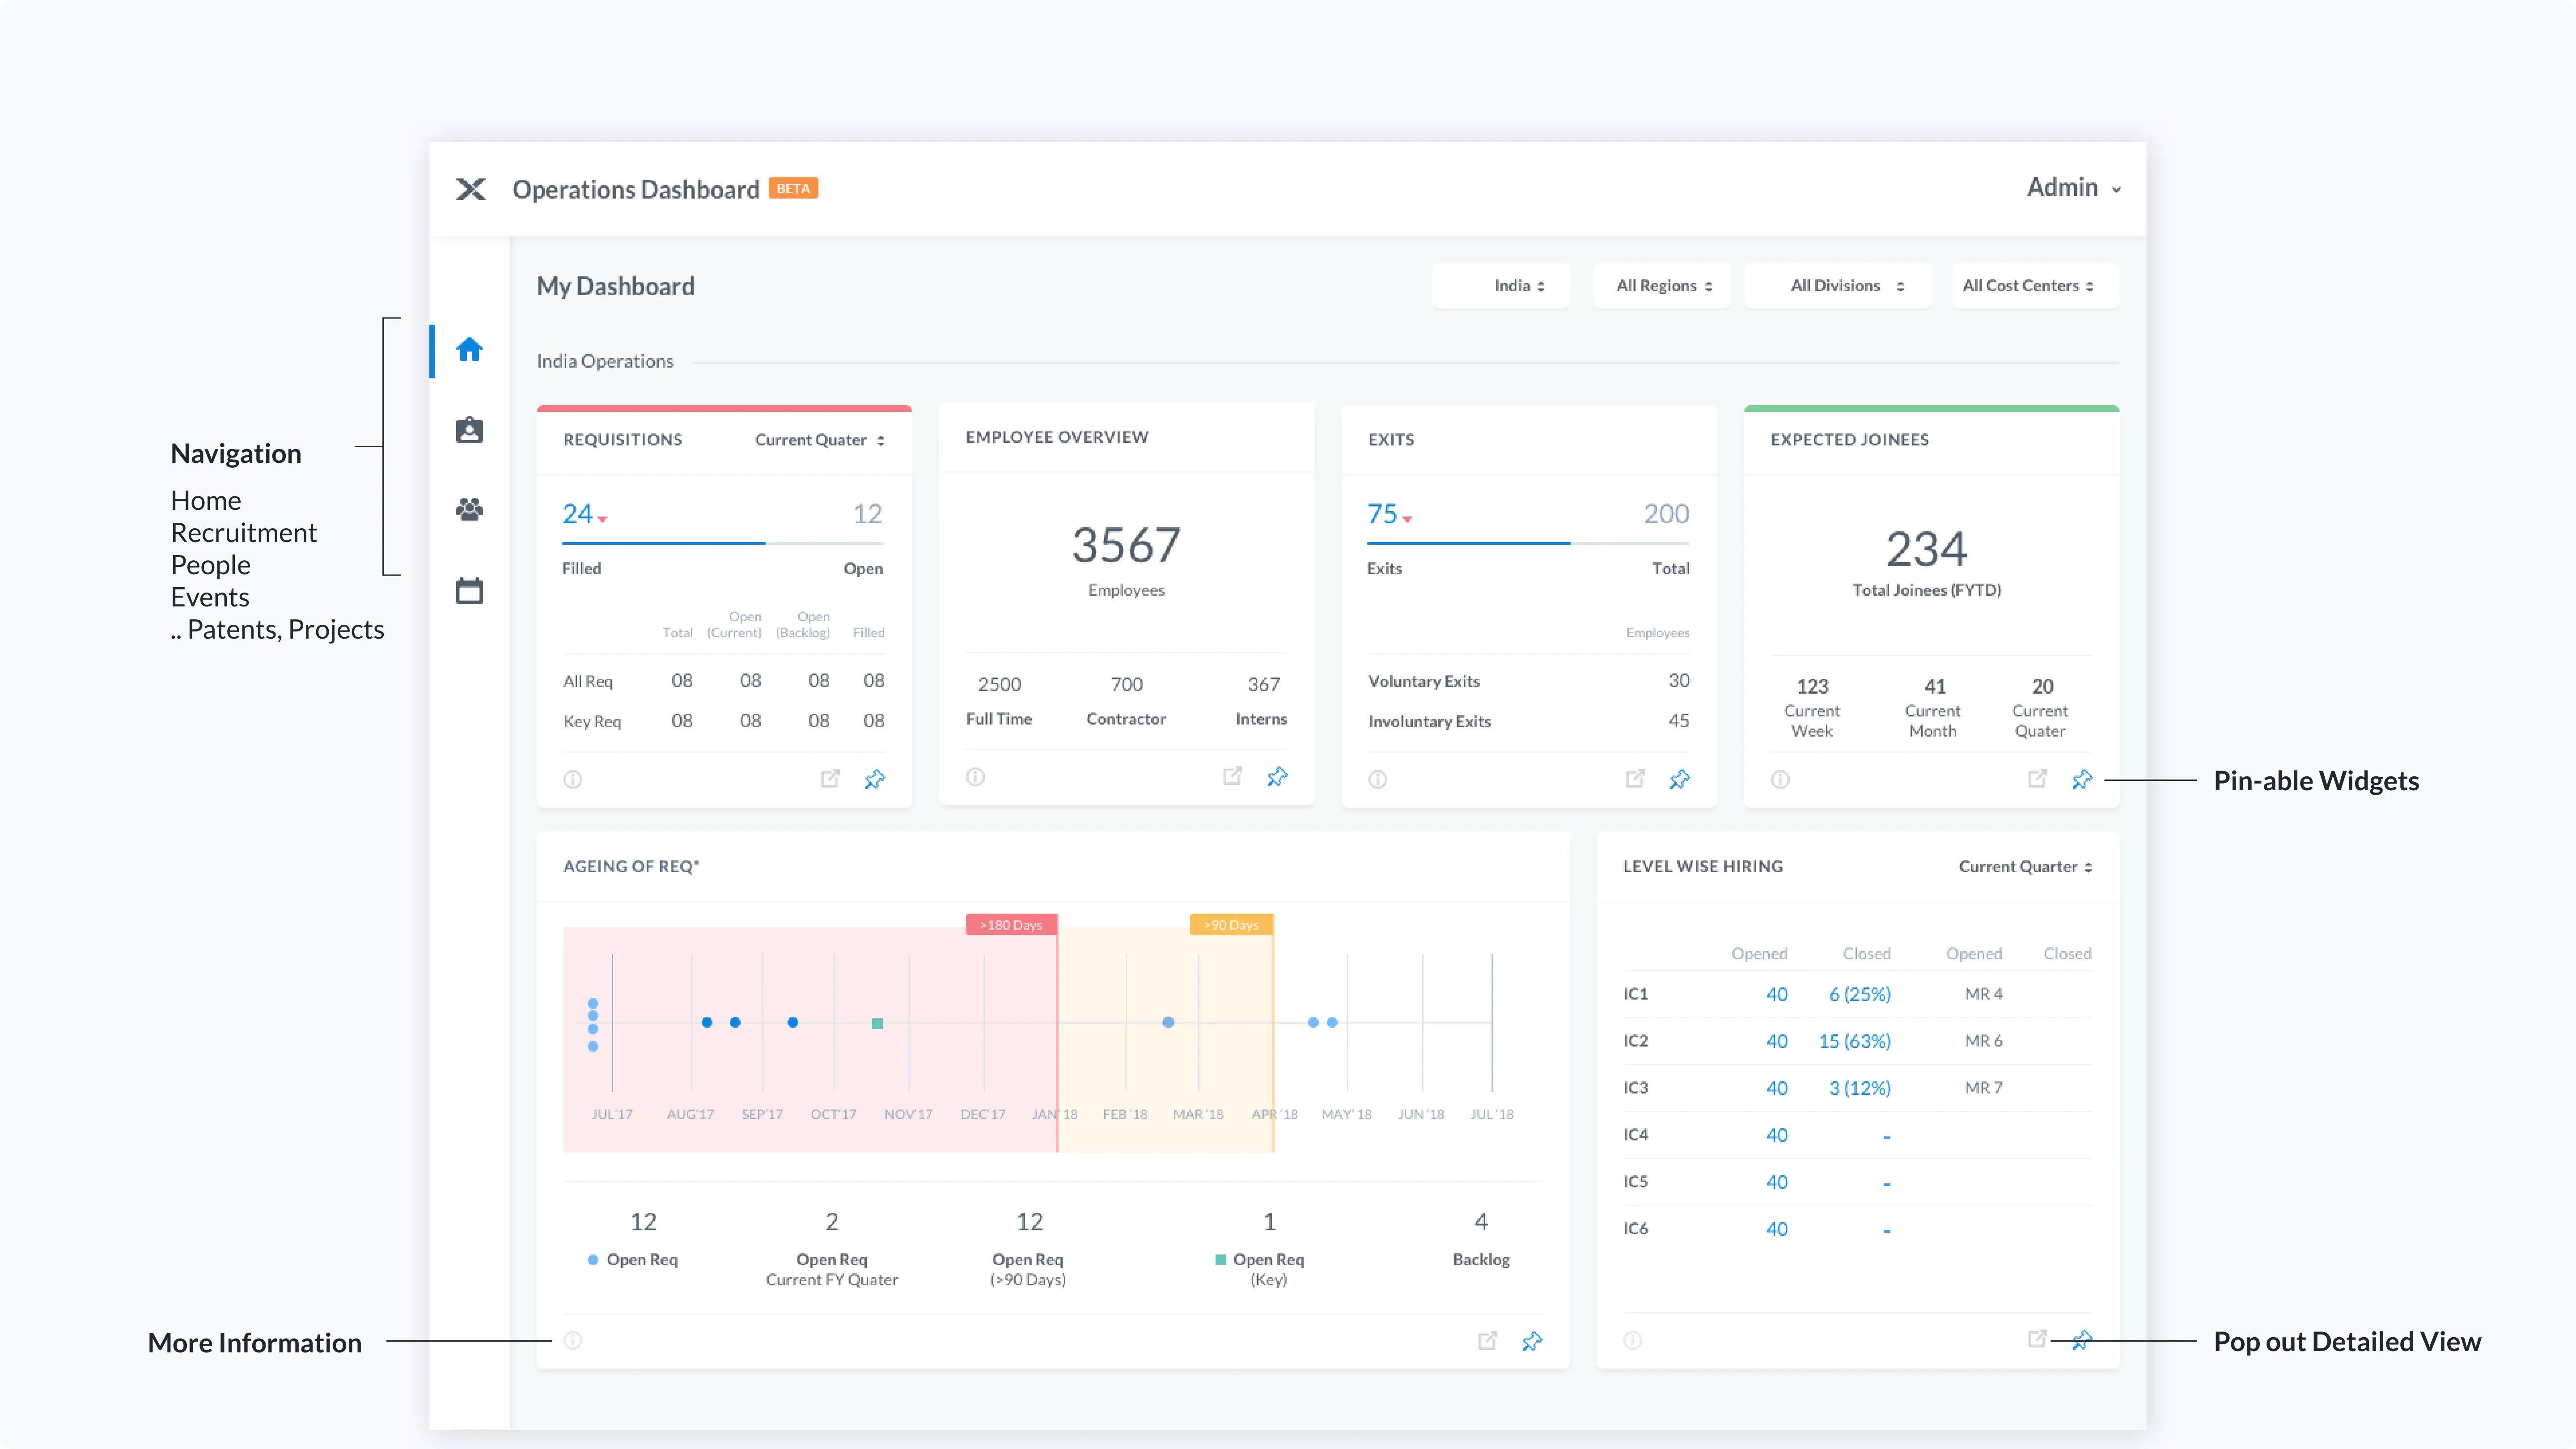
Increased accountability and faster closure.
Used for weekly reporting and analysis in
executive
sync up.
Live Project with 2 months from design inception.
Received appreciation award
from the
SVP, India Head Base for reporting to CEO and make strategic decisions.
Be clear with data sets, deal with dimensions and measures.
Ask questions on how to they are
making decisions by seeing any data sets.
Standardise the values format.
Keep labels and
values
consistent.
Design for different resolutions, 1280 is good to practice.
Scaling
proportionally
or responsively is the question.
Colours plays a huge role in deciding the dashboards.
Iterate
and Iterate again.
Display Screen or Portion thereof with Graphical User Interface for Data Chart
US D931304 S • Issued Sep 21, 2021 • Data chart with summarized view for anomaly detection
Display Screen or Portion thereof with Graphical User Interface with Topological Map
US D931305 S • Issued Sep 21, 2021 • Topological Map for root cause analysis and troubleshooting.
Display Screen or Portion thereof with Graphical User Interface Configurator for Alert Management
US D911356 S · Issued Feb 23, 2021 • UI Configurator using anomaly detection and alert via visualization
Display Screen or Portion thereof with Graphical User Interface for Disaster Recovery
US D908137 S · Issued Jan 19, 2021 • UDesign patent: Visualization for Enterprise Cloud Disaster Recovery Infrastructure

"The visualizations greatly simplify policy management and make it easy to understand how they're being applied. Organizations likely won't choose between VMware vs. Nutanix hyper-converged infrastructures based only on how microsegmentation is implemented. If they do, they'll probably weigh Flow's simplicity against NSX's extensive feature set."
TechTarget: Microsegmentation networking: Nutanix Flow vs. VMware NSX HCI
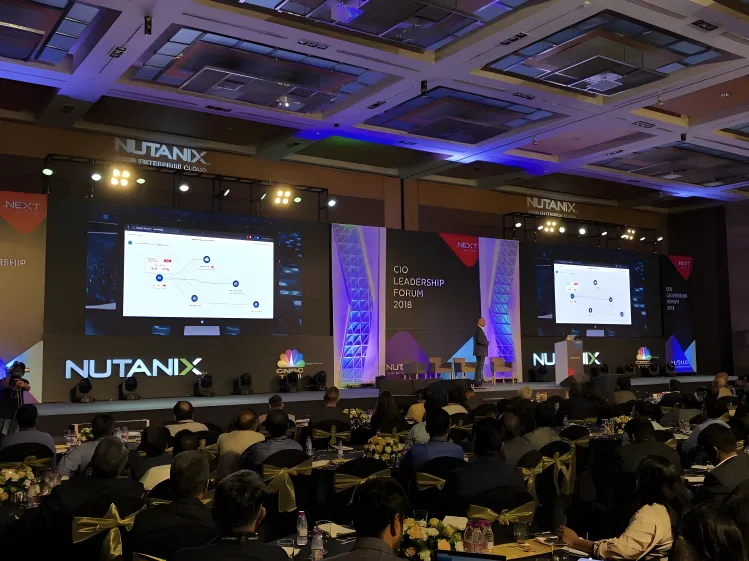
Internship project being presented by Dheeraj Pandey, CEO Nutanix at CIO Leadership Forum 2018.
DR Visualization: The concept was presented by Dheeraj Pandey, CEO of, Nutanix to industry leaders and analysts at .NEXT CIO Leadership Forum 2018.